I’ve been putting together a learning list to help me go deep on machine learning in 2023. After doing a few tutorials reading some docs, and watching a few videos, I jumped onto Pluralsight to see what they had. Given that I’ve been teaching at Pluralsight for more than a decade, I feel silly not checking there first! I bookmarked a few good-looking machine learning courses to watch later, but what really caught my eye was that Google Cloud folks were busy adding and updating tons of courses in the catalog over the past couple of months. Here are a handful of high-quality, educational courses that jumped out at me.
Data and AI/ML
Innovating with Data and Google Cloud. Ninety-minute course that talks about the value of data, types of cloud data services, and what machine learning is about.
Google Cloud Big Data and Machine Learning Fundamentals. This course is two-and-a-half hours long, and has many hands-on labs for streaming data processing, working with BigQuery ML, using pre-built and custom ML models, and working with Vertex AI.
Applying Machine Learning to your Data with Google Cloud. Spend ninety minutes on this excellent overview into machine learning, pre-trained ML APIs, using BigQuery with datasets and ML models, and more. Lots of hands-on exercises here.
Achieving Advanced Insights with BigQuery. This course is a bit under two hours, and you get to use some advanced SQL, learn about schema design, understand how to optimize BigQuery for performance, and go hands on with BigQuery and Vertex AI.
Managing Machine Learning Projects with Google Cloud. This four-and-a-half hour course covers ML practices, building and evaluating ML models, identifying real-world use cases, and managing ML projects. It’s got some hands-on lab exercises as well.
Building Batch Data Pipelines on Google Cloud. Important topics covered in this two-hour-and-twenty minute course. Watch this to learn about EL/ELT/ETL and cloud services like Dataproc, BigQuery, Dataflow, Data Fusion, and more.
Essential Google Cloud Infrastructure: Core Services. This course is about three-and-a-half hours and covers topics like IAM, storage, databases, and operations. Looks like a very solid overview of the base infrastructure.
Reliable Google Cloud Infrastructure: Design and Process. This is a four+ hour course that helps you architect and design a system that runs on Google Cloud. It’s not about building out the specific components, but rather, about going from requirements to architecture. it covers topics like microservices, automation, reliability, security, maintenance, and more.
Google Cloud Fundamentals for AWS Professionals. Its not about where you come from, but where you’re going. If you started with AWS, you’ll like this three hour course that maps your AWS experience to the equivalent (and better!) experience in Google Cloud. IT covers IAM, VMs, storage, containers, deployment tools, Ops, and more.
Managing Security in Google Cloud. This two+ hour course digs into the foundational aspects of security in Google Cloud—think shared responsibilities model, threat mitigation—along with IAM, and VPCs. Some deep stuff here that will be best for architects, security analysts, and engineers.
Security Best Practices in Google Cloud. Coming in at a shade under two hours, this course has lots of hands-on options to learn about service accounts, confidential VMs, encryption, identity-aware proxy, secret manager, and even GKE security techniques.
Deployments, Day-2, and SRE
Developing a Google SRE Culture. This is a two hour course for leaders. It talks about DevOps and SRE, SLOs, dealing with regulated workloads, and apply SRE to your own organization.
Logging, Monitoring and Observability in Google Cloud. An almost five hour course on operations? BRING IT. Watch this one to learn about alerting policies, dashboards, uptime checks, custom metrics, analyzing logs, network security monitoring, managing incidents, and much more. Very comprehensive.
Develop and Deploy Windows Applications on Google Cloud. This stood out to me because you probably don’t think of Google Cloud as the best home for Windows workloads. You might be surprised. Learn more about how to run Windows apps on Google compute.
I don’t know what your learning journey looks like in 2023, but if you want to go deep on Google Cloud, it might be worth a subscription to Pluralsight for access to this broad catalog.
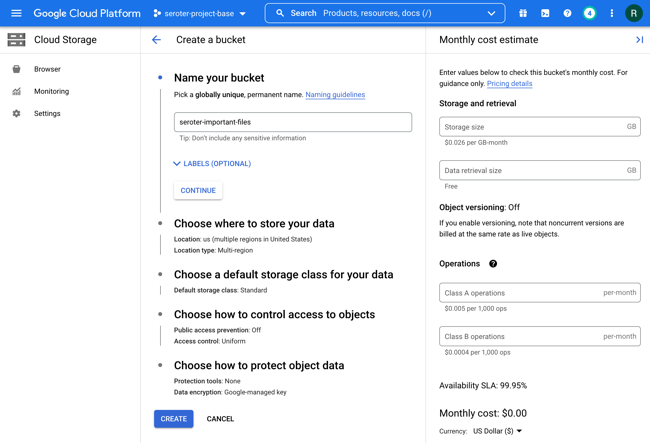
The idea of “backup and restore” in a complex distributed system is bit weird. Is it really even possible? Can you snapshot all the components of an entire system at a single point in time, inclusive of all the side effects in downstream systems? I dunno. But you need to at least have a good recovery story for each of your major stateful components! While Kubernetes started out as a terrific orchestrator for stateless containers, it’s also matured as a runtime for stateful workloads. Lots of folks are now using Kubernetes to run databases, event processors, ML models. and even “legacy” apps that maintain local state. Until now, public cloud users have only had DIY or 3rd party options when it comes to backing up their Kubernetes clusters, but not any more. Google Cloud just shipped a new built-in Backup for Google Kubernetes Engine (GKE) feature, and I wanted to try it out.
What Backup for GKE does
Basically, it captures the resources—at the cluster or namespace level—and persistent volumes within a given cluster at a specific point in time. It does not back up cluster configurations themselves (e.g. node pool size, machine types, enabled cluster features). For that, you’d like likely have an infrastructure-as-code approach for stamping out clusters (using something like Terraform), and use Backup for GKE to restore the state of your running app. This diagram from the official docs shows the architecture:
A Kubernetes cluster backup comes from a “backup plan” that defines the scope of a given backup. With these, you choose a cluster to back up, which namespaces you want backed up, and a schedule (if any). To restore a backup into an existing cluster, you execute a pre-defined “restore plan.” All of this is part of a fully managed Google Cloud service, so you’re not stuck operating any of the backup machinery.
Setting up Backup for GKE on a new cluster
Backup for GKE works with existing clusters (see Appendix A below), but I wanted to try it out on a fresh cluster first.
I started with a GKE standard cluster. First, I made sure to choose a Kubernetes version that supported the Backup feature. Right now, that’s Kubernetes 1.24 or higher.
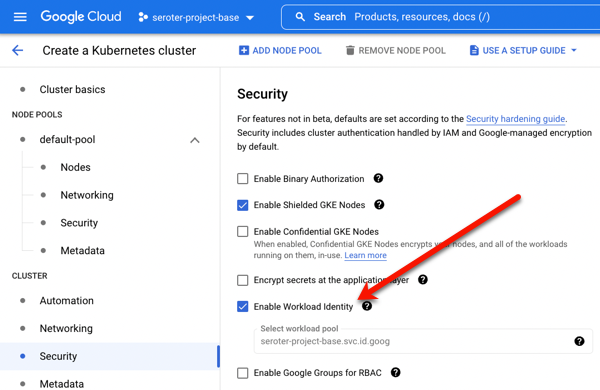
I also turned on two features at the cluster-level. The first was Workload Identity. This security feature enforces more granular, workload-specific permissions to access other Google Cloud services.
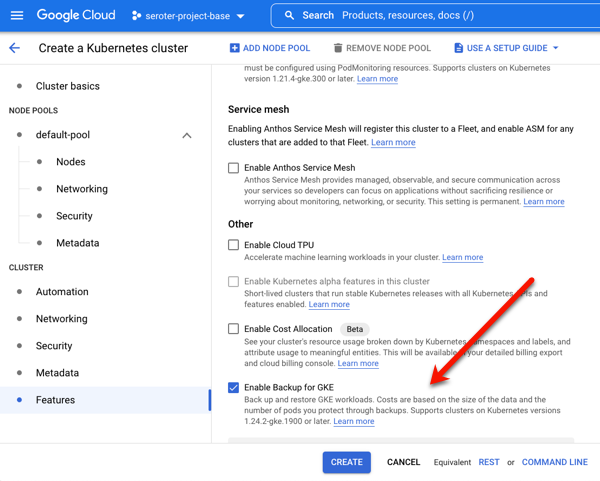
The second and final feature to enable is Backup for GKE. This injects the agent into the cluster and connects it to the control plane.
Deploying a stateful app to Kubernetes
Once my cluster was up and running, I wanted to deploy a simple web application to it. What’s the app? I created a poorly-written Go app that has a web form to collect support tickets. After you submit a ticket, I route it to Google Cloud Pub/Sub, write an entry into a directory, and then take the result of the cloud request and jam the identifier into a file on another directory. What does this app prove? Two things. First, it should flex Workload Identity by successfully publishing to Pub/Sub. And second, I wanted to observe how stateful backups worked, so I’m writing files to two directories, one that can be backed by a persistent volume, and one backed by a local (node) volume.
I built and containerized the app automatically by using a Cloud Buildpack within a Cloud Build manifest, and invoking a single command:
gcloud builds submit --config cloudbuild.yaml
I then logged into my just-created GKE cluster and created a new namespace to hold my application and specific permissions.
kubectl create ns demos
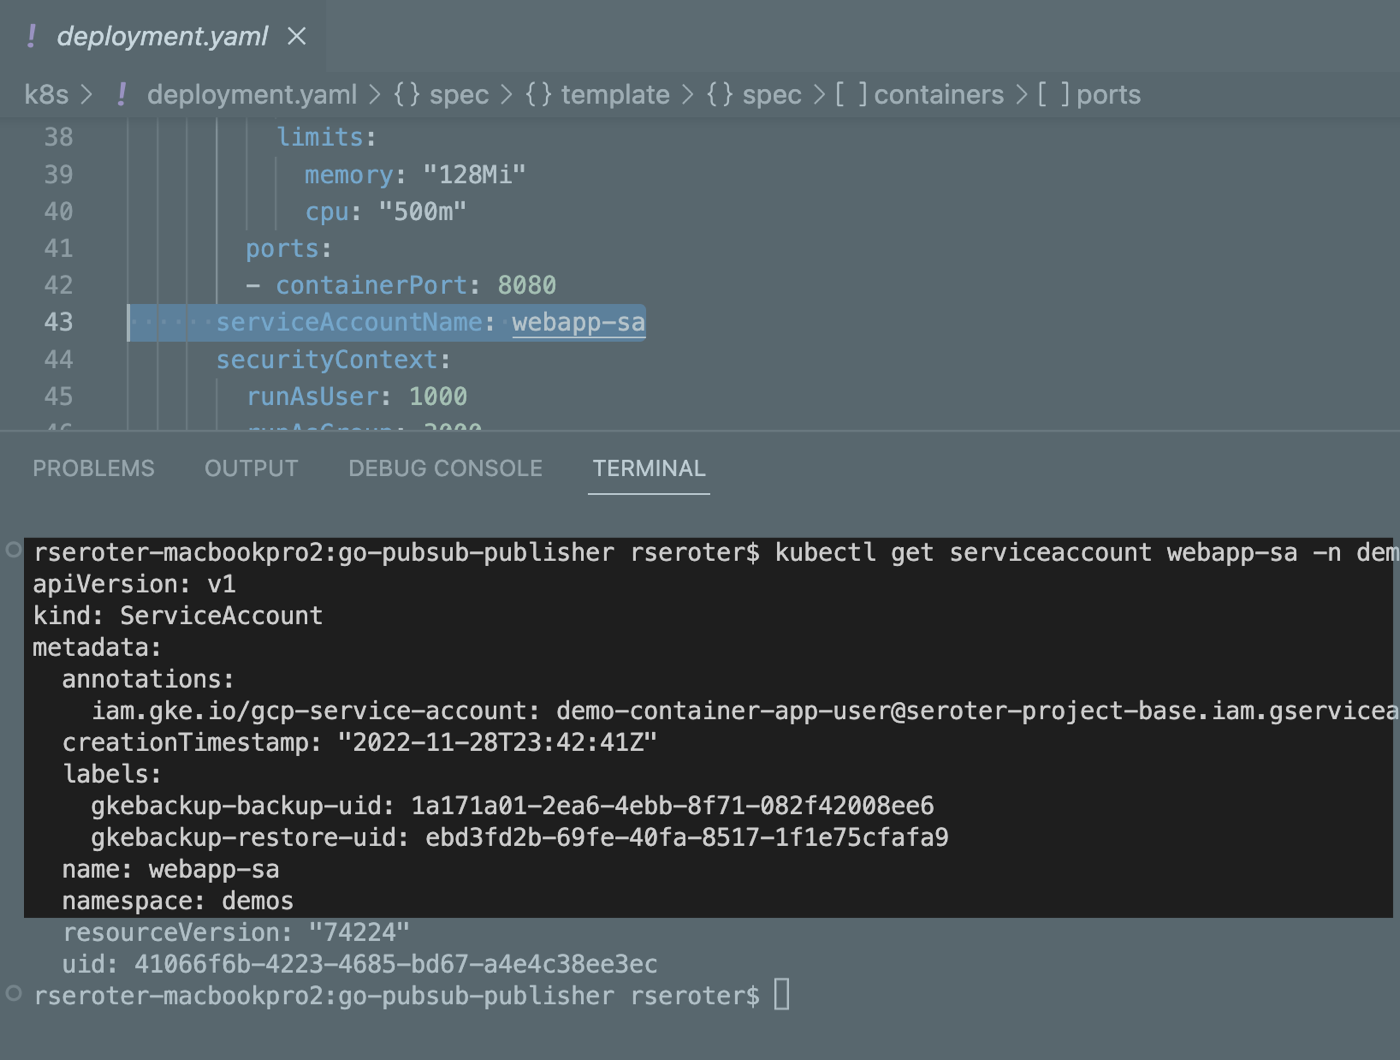
To light up Workload Identity, you create a local service account in a namespace and map it to an existing Google Cloud IAM account that has the permissions the application should have. I created a Kubernetes service account:
Sweet. Finally, there’s the Kubernetes deployment YAML that points to my app container, service account, and the two volumes used by my app. At the top is my definition of the persistent volume, and then the deployment itself.
I applied the above manifest (and a services definition) to my GKE cluster with the following command:
kubectl apply -f k8s/. -n demos
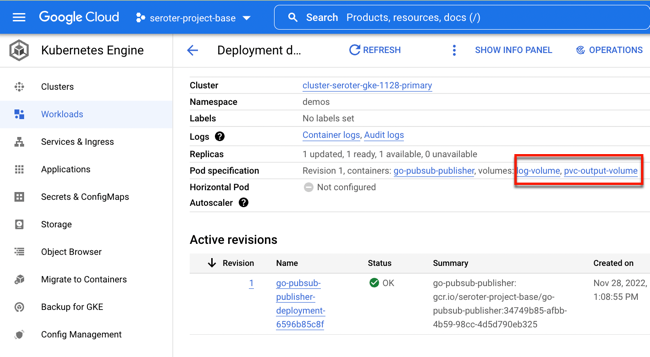
A moment afterwards, I saw a deployment and service. The deployment showed two associated volumes, including the auto-created persistent disk based on my declarative request.
Let’s triple check that. I got the name of the pod and got a shell into the running container. See below that both directories show up, and my app isn’t aware of which one is from a persistent volume and which is not.
I pulled up the web page for the app, and entered a few new “support tickets” into the system. The Pub/Sub UI lets me pull messages from a topic subscription, and we see my submitted tickets there.
The next thing to check is the container’s volumes. Sure enough, I saw the contents of each message written to the local directory (/logs) and the message IDs written to the persistent directory (/acks).
Running a backup and restore
Let’s back that thing up.
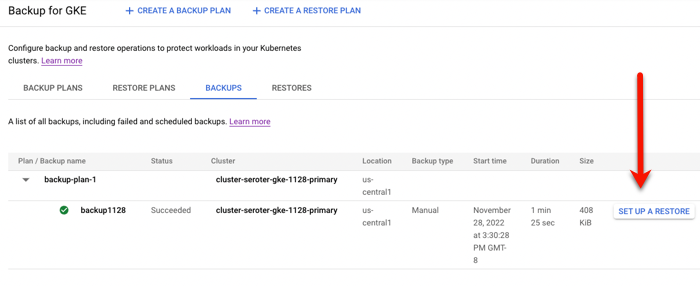
Backup plans are tied to a cluster. You can see here that my primary cluster (with our deployed app) and new secondary cluster (empty) have zero plans.
I clicked the “create a backup plan” button at the top of this page, and got asked for some initial plan details.
That all seemed straightforward. Then it got real. My next options included the ability to back up ALL the namespaces of the cluster, specific ones, or “protected” (more customized) configs. I just chose our “demos” namespace for backup. Also note that I could choose to back up persistent volume data and control encryption.
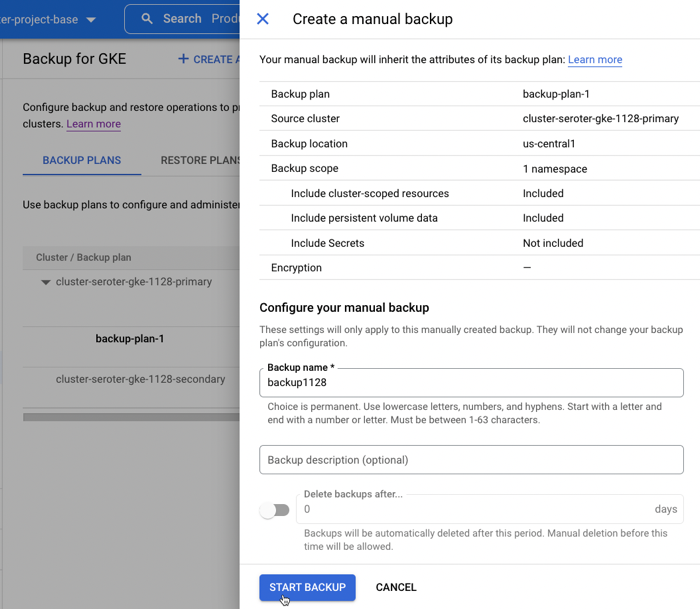
Next, I was asked to choose the frequency of backups. This is defined in the form of a CRON expression. I could back up every few minutes, once a month, or every year. If I leave this “schedule” empty, this becomes an on-demand backup plan.
After reviewing all my settings, I saved the backup plan. Then I manually kicked off a backup by providing the name and retention period for the backup.
To do anything with this backup, I need a “restore plan.” I clicked the button to create a new restore plan, and was asked to connect it to a backup plan, and a target cluster.
Next, I had the choice of restoring some, or all, namespaces. In real life, you might back up everything, and then selectively restore. I like that you’re asked about conflict handling, which determines what happens if the target cluster already has the specified namespace in there. There are also a handful of flexible options for restoring volume data, ranging from creating new volumes, to re-using existing, to not restoring anything.
After that, I was asked about cluster-scoped resources. It pre-loaded a few API groups and Object kinds to restore, and offered me the option to overwrite any existing resources.
Finally, I got asked for any substitution rules to swap backed up values for different ones. With that, I finished my restore plan and had everything I needed to test my backup.
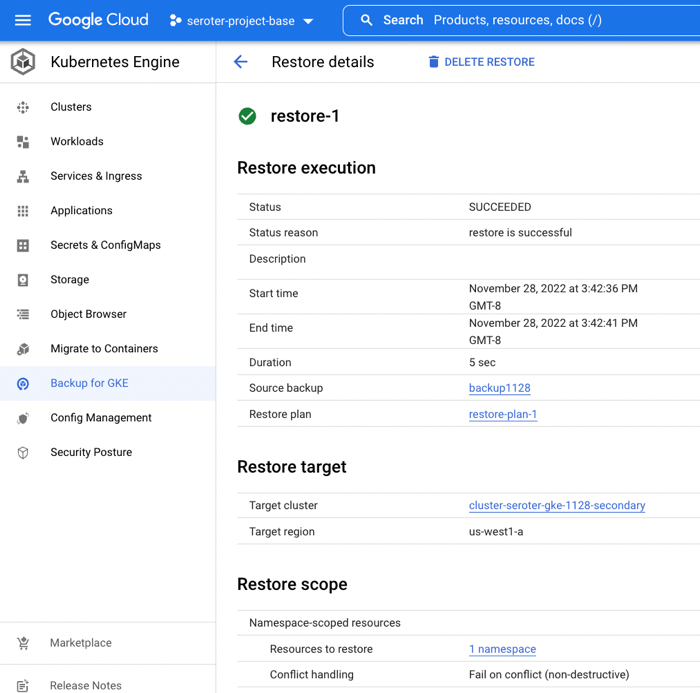
I set up a restore, which basically just involved choosing a restore plan (which is connected to a backup, and target cluster). In just a few moments, I saw a “succeeded” message and it looked like it worked.
When I checked out the GKE “workloads” view, I saw both the original and “restored” deployment running.
I logged into the “secondary” GKE cluster and saw my custom namespace and workload. I also checked, and saw that my custom service account (and Workload Identity-ready annotation) came over in the restore action.
Next, I grabbed a shell into the container to check my stateful data. What did I find? The “local” volume from the original container (“logs”) was empty. Which makes sense. That wasn’t backed by a persistent disk. The “acks” directory, on the other hand, was backed up, and shows up intact as part of the restore.
To test out my “restored” app instance, I submitted a new ticket, saw it show up in Pub/Sub (it just worked, as Workload Identity was in place), and also saw the new log file, and updated “ids.txt” file.
Pretty cool! With Backup for GKE, you don’t deal with the installation, patching, or management of your backup infrastructure, and get a fairly sophisticated mechanism for resilience in your distributed system.
Appendix A: Setting up Backup for GKE on an an existing cluster
Backup for GKE doesn’t only work with new clusters. You can add it to most existing GKE clusters. And these clusters can act as either sources or targets!
First, let’s talk about GKE Autopilot clusters. These are basically hyper-automated GKE standard clusters that incorporate all of Google’s security and scalability best practices. An Autopilot cluster doesn’t yet expose “Backup for GKE” feature at creation time, but you apply if after the fact. You also need to ensure you’re on Kubernetes 1.24 or higher. Workload Identity is enabled by default, so there’s nothing you need to do there.
But let’s talk about an existing GKE standard cluster. If you provision one from scratch, the default security option is to use a service account for the node pool identity. What this means is that any workloads in the cluster will have the same permissions as that account.
If I provision a cluster (cluster #1) like so, the app from above does not work. Why? The “default compute service account” doesn’t have permission to write to a Pub/Sub topic. A second security option is to use a specific service account with the minimum set of permissions needed for the node’s workloads. If I provision cluster #2 and choose a service account with rights to publish to Pub/Sub, my app does work.
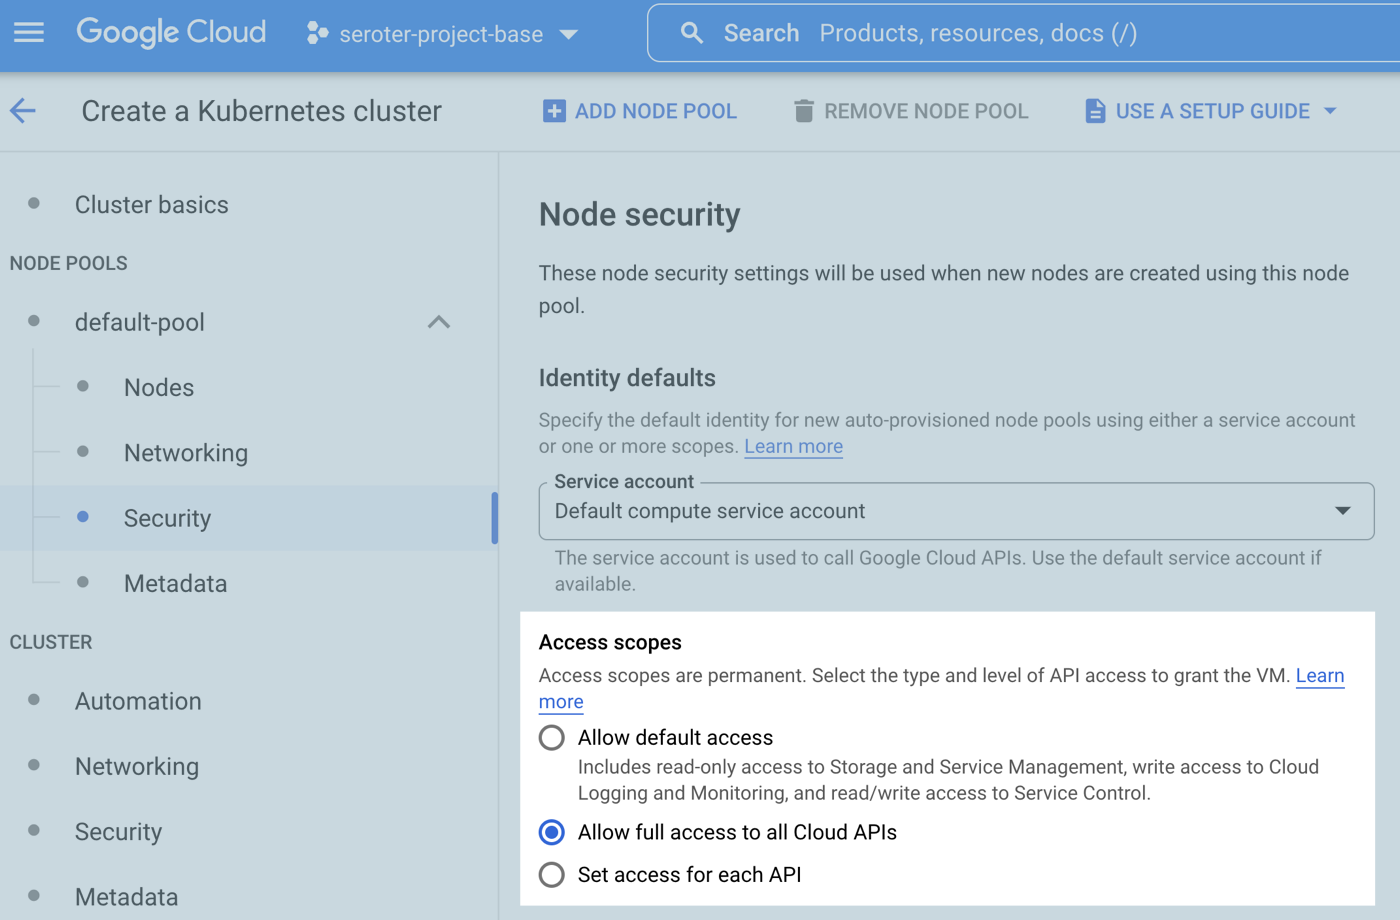
The third security option relates to the access scopes for the cluster. This is a legacy method for authorization. The default setting is “allow default access” which offers a limited set of OAuth-based permissions. If I build a GKE cluster (cluster #3) with a default service account and “allow full access to all cloud APIs” then my app above does work because it has wide-ranging access to all the cloud APIs.
For a GKE standard cluster configured in either of the three ways above, I cannot install Backup for GKE. Why? I have to first enable Workload Identity. Once I edited the three clusters’ settings to enable Workload Identity, my app behaved the same way (not work, work, work)! That surprised me. I expected it to stop using the cluster credentials and require a Workload Identity assignment. What went wrong? For an existing cluster, turning on Workload Identity alone doesn’t trigger the necessary changes for existing node pools. Any new node pools would have everything enabled, but you have to explicitly turn on the GKE Metadata Server for any existing node pools.
This GKE Metadata Server is automatically turned on for any new node pools when you enable Workload Identity, and if you choose to install Workload Identity on a new cluster, it’s also automatically enabled for the first node pool. I didn’t totally understand all this until I tried out a few scenarios!
Once you’re running a supported version of Kubernetes and have Workload Identity enabled on a cluster, you can enroll it in Backup for GKE.
Want to constantly deploy updates to your web app through the use of automation? Not everyone does it, but it’s a mostly solved problem with mature patterns and tools that make it possible. Automated deployments of databases, app services, and data warehouses? Also possible, but not something I personally see done as often. Let’s change that!
Last month, I was tweeting about Liquibase, and their CTO and co-founder pointed out to me that Google Cloud contributed a BigQuery extension. Given that Liquibase is a well-known tool for automating database changes, I figured it was time to dig in and see how it worked, especially for a fully managed data warehouse like BigQuery. Specifically, I wanted to prove out four things:
Use the Liquibase CLI locally to add columns to a BigQuery table. This is an easy way to get started!
Use the Liquibase Docker image to add columns to a BigQuery table. See how to deploy changes through a Docker container, which makes later automation easier.
Use the Liquibase Docker image within Cloud Build to automate deployment of a BigQuery table change. Bring in continuous integration (and general automation service) Google Cloud Build to invoke the Liquibase container to push BigQuery changes.
Use Cloud Build and Cloud Deploy to automate the build and deployment of the app to GKE along with a BigQuery table change. This feels like the ideal state, where Cloud Build does app packaging, and then hands off to Cloud Deploy to push BigQuery changes (using the Docker image) and the web app through dev/test/prod.
I learned a lot of new things by performing this exercise! I’ll share all my code and lessons learned about Docker, Kubernetes, init containers, and Liquibase throughout this post.
Scenario #1 – Use Liquibase CLI
The concepts behind Liquibase are fairly straightforward: define a connection string to your data source, and create a configuration file that represents the desired change to your database. A Liquibase-driven change isn’t oriented adding data itself to a database (although, it can), but for making structural changes like adding tables, creating views, and adding foreign key constraints. Liquibase also does things like change tracking, change locks, and assistance with rollbacks.
I downloaded the CLI installer for my Mac, which added the bits to a local directory. And then I checked to see if I could access the liquibase CLI from the console.
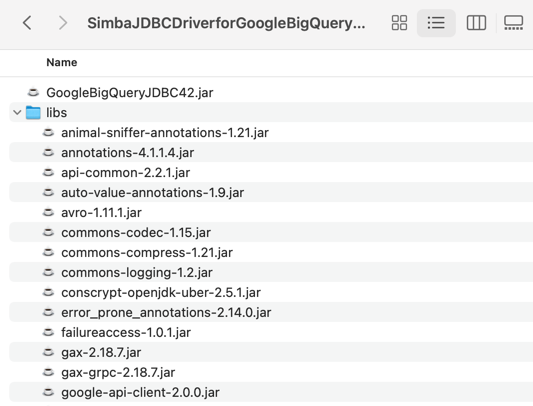
Next, I downloaded the BigQuery JDBC driver which is what Liquibase uses to connect to my BigQuery. The downloaded package includes the JDBC driver along with a “lib” folder containing a bunch of dependencies.
I added *all* of those files—the GoogleBigQueryJDBC42.jar file and everything in the “lib” folder—to the “lib” folder included in the liquibase install directory.
Next, I grabbed the latest BigQuery extension for Liquibase and installed that single JAR file into the same “lib” folder in the local liquibase directory. That’s it for getting the CLI properly loaded.
What about BigQuery itself? Anything to do there? Not really. When experimenting, I got “dataset not found” from Liquibase when using a specific region like “us-west1” so I created a dataset the wider “US” region and everything worked fine.
I added a simple table to this dataset and started it off with two columns.
Now I was ready to trigger some BigQuery changes! I had a local folder (doesn’t need to be where the CLI was installed) with two files: liquibase.properties, and changelog.yaml. The properties file (details here) includes the database connection string, among other key attributes. I turned on verbose logging, which was very helpful in finding obscure issues with my setup! Also, I want to use environmental credentials (saved locally, or available within a cloud instance by default) versus entering creds in the file, so the OAuthType is set to “3”.
#point to where the file is containing the changelog to execute
changelogFile: changelog.yaml
#identify which driver to use for connectivity
driver: com.simba.googlebigquery.jdbc.Driver
#set the connection string for bigquery
url: jdbc:bigquery://https://googleapis.com/bigquery/v2:443;ProjectId=seroter-project-base;DefaultDataset=employee_dataset;OAuthType=3;
#log all the things
logLevel: 0
#if not using the "hub" features
liquibase.hub.mode=off
Next I created the actual change log. There are lots of things you can do here, and change files can be authored in JSON, XML, SQL, or YAML. I chose YAML, because I know how to have a good time. The BigQuery driver supports most of the Liquibase commands, and I chose the one to add a new column to my table.
Once you get all the setup in place, the actual Liquibase stuff is fairly simple! To execute this change, I jumped into the CLI, navigated to the folder holding the properties file and change log, and issued a single command.
liquibase --changeLogFile=changelog.yaml update
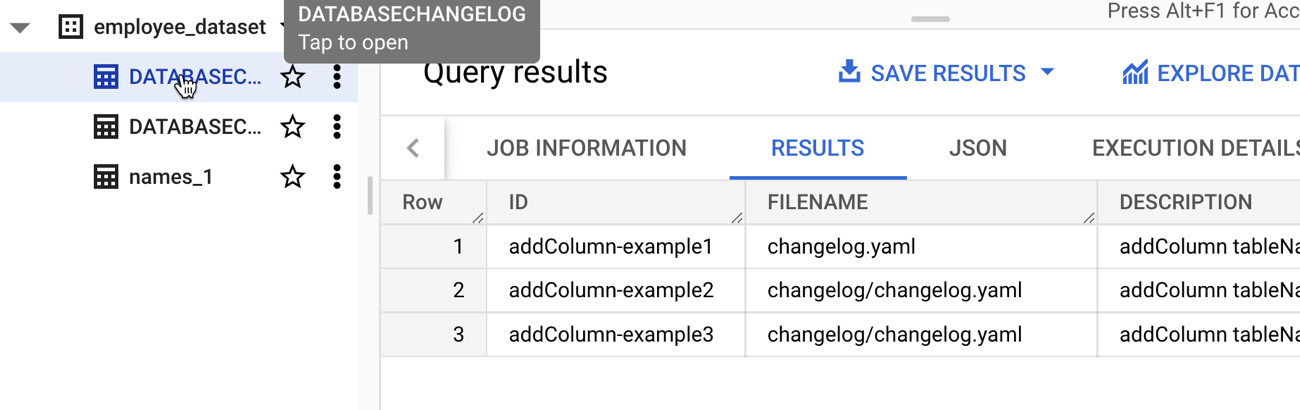
Assuming you have all the authentication and authorization settings correct and files defined and formatted in the right way, the command should complete successfully. In BigQuery, I saw that my table had a new column.
Note that this command is idempotent. I can execute it again and again with no errors or side effects. After I executed the command, I saw two new tables added to my dataset. If I had set the “liquibaseSchemaName” property in the properties file, I could have put these tables into a different dataset of my choosing. What are they for? The DATABASECHANGELOGLOCK table is used to create a “lock” on the database change so that only one process at a time can make updates. The DATABASECHANGELOG table stores details of what was done, when. Be aware that each changeset itself is unique, so if I tried to run a new change (add a different column) with the same changeset id (above, set to “addColumn-example1”), I’d get an error.
That’s it for the CLI example. Not too bad!
Scenario #2 – Use Liquibase Docker image
The CLI is cool, but maybe you want an even more portable way to trigger a database change? Liquibase offers a Docker image that has the CLI and necessary bits loaded up for you.
To test this out, I fired up an instance of the Google Cloud Shell—this is an dev environment that you can access within our Console or standalone. From here, I created a local directory (lq) and added folders for “changelog” and “lib.” I uploaded all the BigQuery JDBC JAR files, as well as the Liquibase BigQuery driver JAR file.
I also uploaded the liquibase.properties file and changelog.yaml file to the “changelog” folder in my Cloud Shell. I opened the changelog.yaml file in the editor, and updated the changeset identifier and set a new column name.
All that’s left is to start the Docker container. Note that you might find it easier to create a new Docker image based on the base Liquibase image with all the extra JAR files embedded within it instead of schlepping the JARs all over the place. In my case here, I wanted to keep it all separate. To ensure that the Liquibase Docker container “sees” all my config files and JAR files, I needed to mount volumes when I started the container. The first volume mount maps from my local “changelog” directory to the “/liquibase/changelog” directory in the container. The second maps from the local “lib” directory to the right spot in the container. And by mounting all those JARs into the container’s “lib” directory—while also setting the “–include-system-classpath” flag to ensure it loads everything it finds there—the container has everything it needs. Here’s the whole Docker command:
After 30 seconds or so, I saw the new column added to my BigQuery table.
To be honest, this doesn’t feel like it’s that much simpler than just using the CLI, but, by learning how to use the container mechanism, I could now embed this database change process into a container-native cloud build tool.
Scenario #3 – Automate using Cloud Build
Those first two scenarios are helpful for learning how to do declarative changes to your database. Now it’s time to do something more automated and sustainable. In this scenario, I tried using Google Cloud Build to automate the deployment of my database changes.
Cloud Build runs each “step” of the build process in a container. These steps can do all sorts of things, ranging from compiling your code, running tests, pushing to artifact storage, or deploy a workload. Since it can honestly run any container, we could also use the Liquibase container image as a “step” of the build. Let’s see how it works.
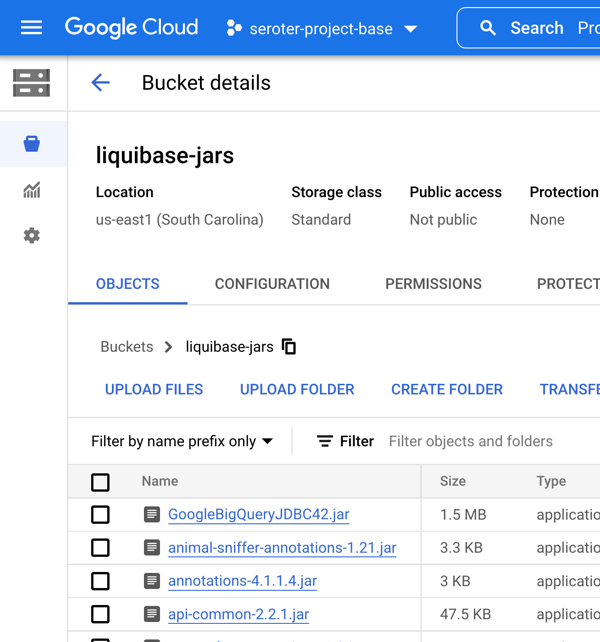
My first challenge related to getting all those JDBC and driver JAR files into Cloud Build! How could the Docker container “see” them? To start, I put all the JAR files and config files (updated with a new column named “title”) into Google Cloud Storage buckets. This gave me easy, anywhere access to the files.
Then, I decided to take advantage of Cloud Build’s built-in volume for sharing data between the independent build steps. This way, I could retrieve the files, store them, and then the Liquibase container could see them on the shared volume. In real life, you’d probably grab the config files from a Git repo, and the JAR files from a bucket. We’ll do that in the next scenario! Be aware that there’s also a project out there for mounting Cloud Storage buckets as volumes, but I didn’t feel like trying to do that. Here’s my complete Cloud Build manifest:
The first “step” uses a container that’s pre-loaded with the Cloud Storage CLI. I executed the “copy” command and put all the JAR files into the built-in “workspace” volume. The second step does something similar by grabbing all the “config” files and dropping them into another folder within the “workspace” volume.
Then the “big” step executed a virtually identical Docker “run” command as in scenario #2. I pointed to the “workspace” directories for the mounted volumes. Note the “–network” flag which is a magic command for using default credentials.
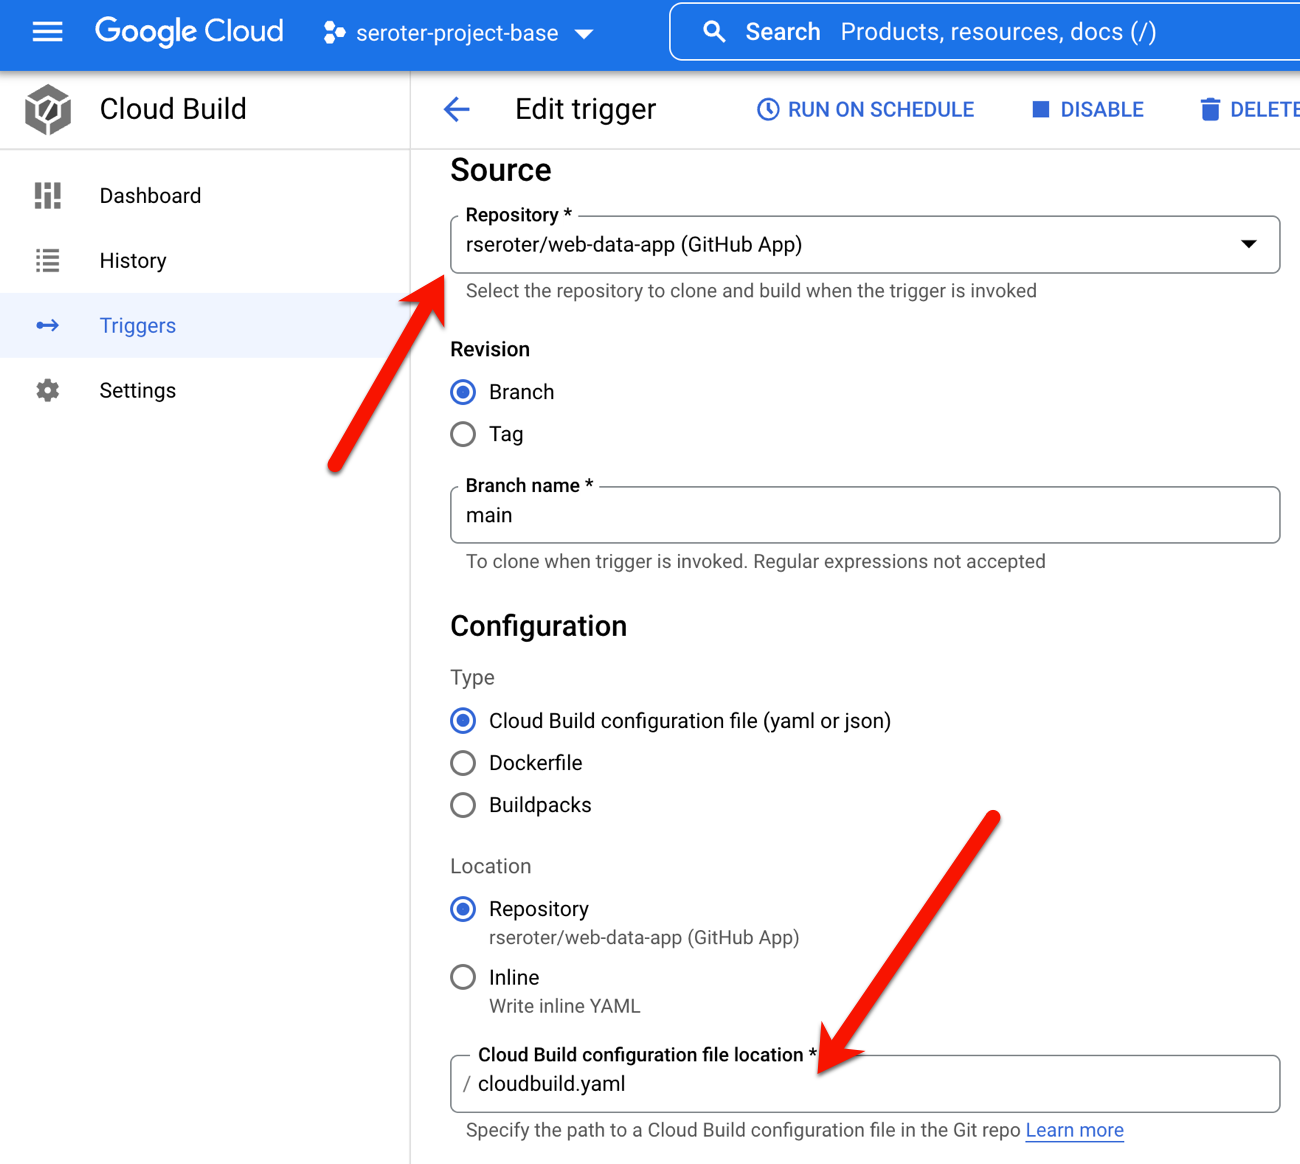
I jumped into the Google Cloud Console and created a new Cloud Build trigger. Since I’m not (yet) using a git repo for configs, but I have to pick SOMETHING when building a trigger, I chose a random repo of mine. I chose an “inline” Cloud Build definition and pasted in the YAML above.
That’s it. I saved the trigger, ensured the “Cloud Build” account had appropriate permissions to update BigQuery, and “ran” the Cloud Build job.
I saw the new column in my BigQuery table as a result and if I looked at the “change table” managed by Liquibase, I saw each of the three change we did so far.
Scenario #4 – Automate using Cloud Build and Cloud Deploy
So far so good. But it doesn’t feel “done” yet. What I really want is to take a web application that writes to BigQuery, and deploy that, along with BigQuery changes, in one automated process. And I want to use the “right” tools, so I should use Cloud Build to package the app, and Google Cloud Deploy to push the app to GKE.
I first built a new web app using Node.js. This very simple app asks you to enter the name of an employee, and it adds that employee to a BigQuery table. I’m seeking seed funding for this app now if you want to invest. The heart of this app’s functionality is in its router:
router.post('/', async function(req, res, next) {
    console.log('called post - creating row for ' + req.body.inputname)

    const row = [
        {empid: uuidv4(), fullname: req.body.inputname}
      ];

    // Insert data into a table
    await bigquery
    .dataset('employee_dataset')
    .table('names_1')
    .insert(row);
    console.log(`Inserted 1 rows`);


    res.render('index', { title: 'Employee Entry Form' });
  });
Before defining our Cloud Build process that packages the app, I wanted to create all the Cloud Deploy artifacts. These artifacts consist of a set of Kubernetes deployment files, a Skaffold configuration, and finally, a pipeline definition. The Kubernetes deployments get associated to a profile (dev/prod) in the Skaffold file, and the pipeline definition identifies the target GKE clusters.
Let’s look at the Kubernetes deployment file for the “dev” environment. To execute the Liquibase container before deploying my Node.js application, I decided to use Kubernetes init containers. These run (and finish) before the actual container you care about. But I had the same challenge as with Cloud Build. How do I pass the config files and JAR files to the Liquibase container? Fortunately, Kubernetes offers up Volumes as well. Basically, the below deployment file does the following things:
Create an empty volume called “workspace.”
Runs an init container that executes a script to create the “changelog” and “lib” folders in the workspace volume. For whatever reason, the Cloud Storage CLI wouldn’t do it automatically for me, so I added this distinct step.
Runs an init container that git clones the latest config files from my GitHub project (no longer using Cloud Storage) and stashes them in the “changelog” directory in the workspace volume.
Runs a third init container to retrieve the JAR files from Cloud Storage and stuff them into the “lib” directory in the workspace volume.
Runs a final init container that mounts each directory to the right place in the container (using subpath references), and runs the “liquibase update” command.
Runs the application container holding our web app.
The only difference between the “dev” and “prod” deployments is that I named the running containers something different. Each deployment also has a corresponding “service.yaml” file that exposes the container with a public endpoint.
Ok, so we have configs. That’s the hard part, and took me the longest to figure out! The rest is straightforward.
I defined a skaffold.yaml file which Cloud Deploy uses to render right assets for each environment.
Skaffold is a cool tool for local development, but I won’t go into it here. The only other asset we need for Cloud Deploy is the actual pipeline definition! Here, I’m pointing to my two Google Kubernetes Engine clusters (with platform-wide access scopes) that represent dev and prod environments.
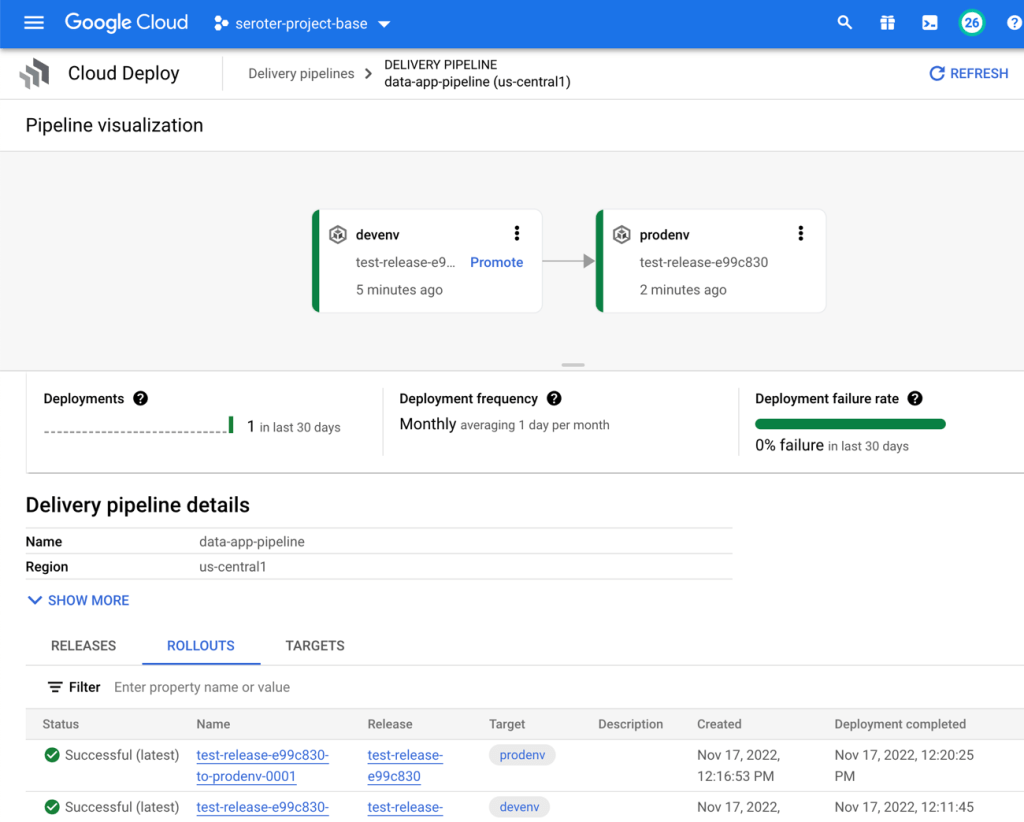
In the Cloud Console, I saw a visual representation of my jazzy new pipeline.
The last step is to create the Cloud Build definition which builds my Node.js app, stashes it into Google Cloud Artifact Registry, and then triggers a Cloud Deploy “release.” You can see that I point to the Skaffold file, which in turns knows where the latest Kubernetes deployment/service YAML files are at. Note that I use a substitution value here with –images where the “web-data-app” value in each Kubernetes deployment file gets swapped out with the newly generated image identifier.
To make all this magic work, I went into Google Cloud Build to set up my new trigger. It points at my GitHub repo and refers to the cloudbuild.yaml file there.
I ran my trigger manually (I could also set it to run on every check-in) to build my app and initiate a release in Cloud Deploy. The first part ran quickly and successfully.
The result? It worked! My “dev” GKE cluster got a new workload and service endpoint, and my BigQuery table got a new column.
When I went back into Cloud Deploy, I “promoted” this release to production and it ran the production-aligned files and popped a workload into the other GKE cluster. And it didn’t make any BigQuery changes, because we already did on the previous run. In reality, you would probably have different BigQuery tables or datasets for each environment!
Wrap up
Did you make it this far? You’re amazing. It might be time to shift from just shipping the easy stuff through automation to shipping ALL the stuff via automation. Software like Liquibase definition gets you further along in the journey, and it’s good to see Google Cloud make it easier.
Is code a liability or an asset? What it does should be an asset, of course. But there’s a cost to running and maintaining code. Ideally, we take advantage of (managed) services that minimize how much code we have to write to accomplish something.
What if I want to accept document from a partner or legacy business system, send out a request for internal review of that document, and then continue processing? In ye olden days, I’d build file watchers, maybe a database to hold state of in-progress reviews, a poller that notified reviewers, and a web service endpoint to handle responses and update state in the database. That’s potentially a lot of code. Can we get rid of most that?
Google Cloud Workflows recently added a “callback” functionality which makes it easier to create long-running processes with humans in the middle. Let’s build out an event-driven example with minimal code, featuring Cloud Storage, Eventarc, Cloud Workflows, and Cloud Run.
Step 1 – Configure Cloud Storage
Our system depends on new documents getting added to a storage location. That should initiate the processing. Google Cloud Storage is a good choice for an object store.
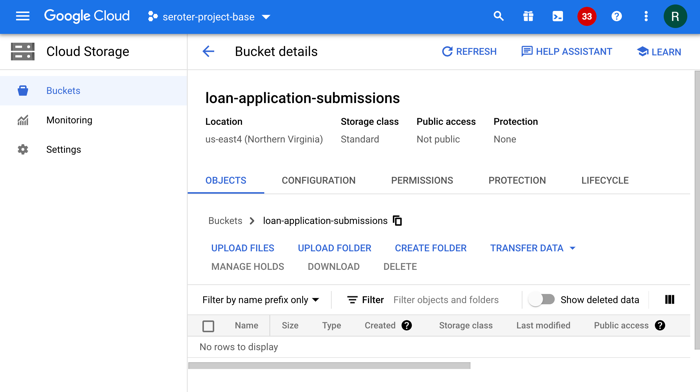
I created a new bucket named “loan-application-submissions’ in our us-east4 region. At the moment, the bucket is empty.
Step 2 – Create Cloud Run app
The only code in our system is the application that’s used to review the document and acknowledge it. The app accepts a querystring parameter that includes the “callback URL” that points to the specific Workflow instance waiting for the response.
I built a basic Go app with a simple HTML page, and a couple of server-side handlers. Let’s go through the heart of it. Note that the full code sample is on GitHub.
func main() {

	fmt.Println("Started up ...")

	e := echo.New()
	e.Use(middleware.Logger())
	e.Use(middleware.Recover())

	t := &Template{
		Templates: template.Must(template.ParseGlob("web/home.html")),
	}

	e.Renderer = t
	e.GET("/", func(c echo.Context) error {
		//load up object with querystring parameters
		wf := workflowdata{LoanId: c.QueryParam("loanid"), CallbackUrl: c.QueryParam("callbackurl")}

		//passing in the template name (not file name)
		return c.Render(http.StatusOK, "home", wf)
	})

	//respond to POST requests and send message to callback URL
	e.POST("/ack", func(c echo.Context) error {
		loanid := c.FormValue("loanid")
		fmt.Println(loanid)
		callbackurl := c.FormValue("callbackurl")

		fmt.Println("Sending workflow callback to " + callbackurl)

		wf := workflowdata{LoanId: loanid, CallbackUrl: callbackurl}

		// Fetch an OAuth2 access token from the metadata server
		oauthToken, errAuth := metadata.Get("instance/service-accounts/default/token")
		if errAuth != nil {
			fmt.Println(errAuth)
		}

		//load up oauth token
		data := OAuth2TokenInfo{}
		errJson := json.Unmarshal([]byte(oauthToken), &data)
		if errJson != nil {
			fmt.Println(errJson.Error())
		}
		fmt.Printf("OAuth2 token: %s", data.Token)

		//setup callback request
		workflowReq, errWorkflowReq := http.NewRequest("POST", callbackurl, strings.NewReader("{}"))
		if errWorkflowReq != nil {
			fmt.Println(errWorkflowReq.Error())
		}

		//add oauth header
		workflowReq.Header.Add("authorization", "Bearer "+data.Token)
		workflowReq.Header.Add("accept", "application/json")
		workflowReq.Header.Add("content-type", "application/json")

		//inboke callback url
		client := &http.Client{}
		workflowResp, workflowErr := client.Do(workflowReq)

		if workflowErr != nil {

			fmt.Printf("Error making callback request: %s\n", workflowErr)
		}
		fmt.Printf("Status code: %d", workflowResp.StatusCode)

		return c.Render(http.StatusOK, "home", wf)
	})

	//simple startup
	e.Logger.Fatal(e.Start(":8080"))
}
The “get” request shows the details that came in via the querystrings. The “post” request generates the required OAuth2 token, adds it to the header, and calls back into Google Cloud Workflows. I got stuck for a while because I was sending an ID token and the service expects an access token. There’s a difference! My colleague Guillaume Laforge, who doesn’t even write Go, put together the code I needed to generate the necessary OAuth2 token.
From a local terminal, I ran a single command to push this source code into our fully managed Cloud Run environment:
gcloud run deploy
After a few moments, the app deployed and I loaded it up the browser with some dummy querystring values.
Step 3 – Create Workflow with event-driven trigger
That was it for coding! The rest of our system is composed of managed services. Specifically, Cloud Workflows, and Eventarc which processes events in Google Cloud and triggers consumers.
I created a new Workflow called “workflow-loans” and chose the new “Eventarc” trigger. This means that the Workflow starts up as a result of an event happening elsewhere in Google Cloud.
A new panel popped up and asked me to name my trigger and pick a source. We offer nearly every Google Cloud service as a source for events. See here that I chose Cloud Storage. Once I chose the event provider, I’m offered a contextual set of events. I selected the “finalized” event which fires for any new object added to the bucket.
Then, I’m asked to choose my storage bucket, and we have a nice picker interface. No need to manually type it in. Once I chose my bucket, which resides in a different region from my Workflow, I’m told as much.
The final step is to add the Workflow definition itself. These can be in YAML or JSON. My Workflow accepts some arguments (properties of the Cloud Storage doc, including the file name), and runs through a series of steps. It extracts the loan number from file name, creates a callback endpoint, logs the URL, waits for a callback, and processes the response.
The full Workflow definition is below, and also in my GitHub repo.
main:
    params: [args]
    steps:
        - setup_variables:
            #define and assign variables for use in the workflow
            assign:
                - version: 100                  #can be numbers
                - filename: ${args.data.name}   #name of doc
        - log_receipt:
            #write a log to share that we started up
            call: sys.log
            args:
                text: ${"Loan doc received"}
        - extract_loan_number:
            #pull out substring containing loan number
            assign:
                - loan_number : ${text.substring(filename, 5, 8)}
        - create_callback:
            #establish a callback endpoint
            call: events.create_callback_endpoint
            args:
                http_callback_method: "POST"
            result: callback_details
        - print_callback_details:
            #print out formatted URL
            call: sys.log
            args:
                severity: "INFO"
                # update with the URL of your Cloud Run service
                text: ${"Callback URL is https://[INSERT CLOUD RUN URL HERE]?loanid="+ loan_number +"&callbackurl=" + callback_details.url}
        - await_callback:
            #wait impatiently
            call: events.await_callback
            args:
                callback: ${callback_details}
                timeout: 3600
            result: callback_request
        - print_callback_request:
            #wlog the result
            call: sys.log
            args:
                severity: "INFO"
                text: ${"Received " + json.encode_to_string(callback_request.http_request)}
        - return_callback_result:
            return: ${callback_request.http_request}
I deployed the Workflow which also generated the Eventarc trigger itself.
Step 4 – Testing it all out
Let’s see if this serverless, event-driven system now works! To start, I dropped a new PDF named “loan600.pdf” into the designated Storage bucket.
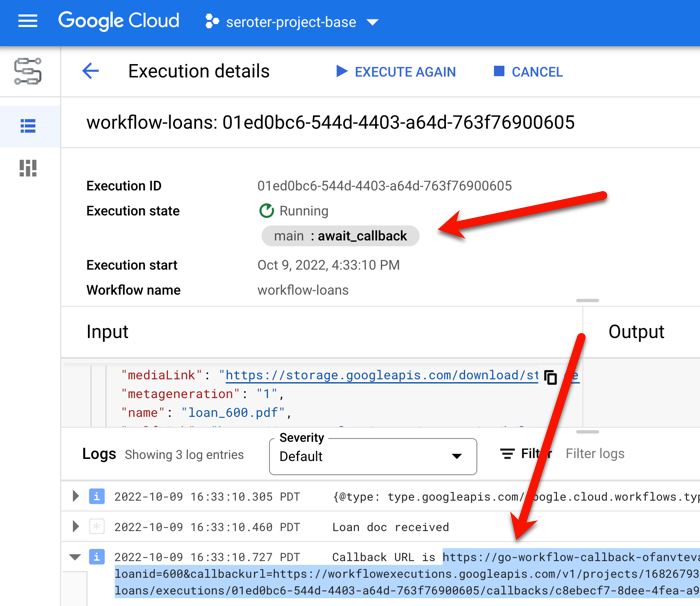
Immediately, Eventarc triggered a Workflow instance because that PDF was uploaded to Cloud Storage. See that the Workflow instance in an “await_callback” stage.
On the same page, notice the logs for the Workflow instance, including the URL for my Cloud Run with all the right querystring parameters loaded.
I plugged that URL into my browser and got my app loaded with the right callback URL.
After clicking the “acknowledge loan submission” button which called back to my running Workflow instance, I switched back to Cloud Workflows and saw that my instance completed successfully.
Summary
There are many ways to solve the problem I called out here. I like this solution. By using Google Cloud Eventarc and Workflows, I eliminated a LOT of code. And since all these services, including Cloud Run, are fully managed serverless services, it only costs me money when it does something. When idle, it costs zero. If you follow along and try it for yourself, let me know how it goes!
First off, I am NOT a data analytics person. My advice is sketchy enough when it comes to app development and distributed systems that I don’t need to overreach into additional areas. That said, we at Google Cloud quietly shipped a new data-related feature this week that sparked my interest, and I figured that we could explore it together.
To be sure, loading data into a data warehouse is a solved problem. Many of us have done this via ETL (extract-transform-load) tools and streaming pipelines for years. It’s all very mature technology, even when steering your data towards newfangled cloud data warehouses like the fully-managed Google Cloud’s BigQuery. Nowadays, app developers can also insert directly into these systems from their code. But what about your event-driven apps? It could be easier than it is today! This is why I liked this new subscription type for Google Cloud Pub/Sub—our messaging engine for routing data between systems—that is explicitly for BigQuery. That’s right, you can directly subscribe your data warehouse to your messaging system.
Let’s try it out, end to end.
First, I needed some data. BigQuery offers an impressive set of public data sets, including those with crime statistics, birth data summaries, GitHub activity, census data, and even baseball statistics. I’m not choosing any of those, because I wanted to learn more about how BigQuery works. So, I built a silly comma-separated file of “pet visits” to my imaginary pet store chain.
I saved this data as “pets.csv” and uploaded it into a private, regional Google Cloud Storage Bucket.
Excellent. Now I wanted this data loaded into a BigQuery table that I could run queries against. And eventually, load new data into when it flows through Pub/Sub.
I’m starting with no existing data sets or tables in BigQuery. You can see here that all I have is my “project.” And there’s no infrastructure to provision or manage here, so all we have to think about is our data. Amazing.
As an aside, we make it very straightforward to pull in data from all sorts of sources, even those outside of Google Cloud. So, this really can be a single solution for all your data analytics needs. Just sayin’. In this scenario, I wanted to add data to a BigQuery table, so I started by selecting my project and choosing to “create a dataset“, which is really just a container for data tables.
Next, I picked my data set and click the menu option to “create table.” Here’s where it gets fun. I can create an empty table, upload some data or point to object storage repos like Google Cloud Storage, Amazon S3, or Azure Blob Storage. I chose Cloud Storage. Then I located my Storage bucket and chose “CSV” as the file format. Other options include JSON, Avro, and Parquet. Then I gave my table a name (“visits_table”). So far so good.
The last part of this table creation process involves schema definition. BigQuery can autodetect the schema (data types and such), but I wanted to define it manually. The graphical interface offers a way to define column name, data type, and whether it’s a required data point or not.
After creating the table, I could see the schema and run queries against the data. For example, this is a query that returns the count of each animal type coming into my chain of pet stores for service.
You could imagine there might be some geospatial analysis, machine learning models, or other things we constantly do with this data set over time. That said, let’s hook it up to Pub/Sub so that we can push a real-time stream of “visits” from our event-driven architecture.
Before we forget, we need to change permissions to allow Pub/Sub to send data to BigQuery tables. From within Google Cloud IAM, I chose to “include Google-provided role grants” in the list of principals, located my built-in Pub/Sub service account, and added the “BigQuery Data Editor” and “BigQuery Metadata Viewer” roles.
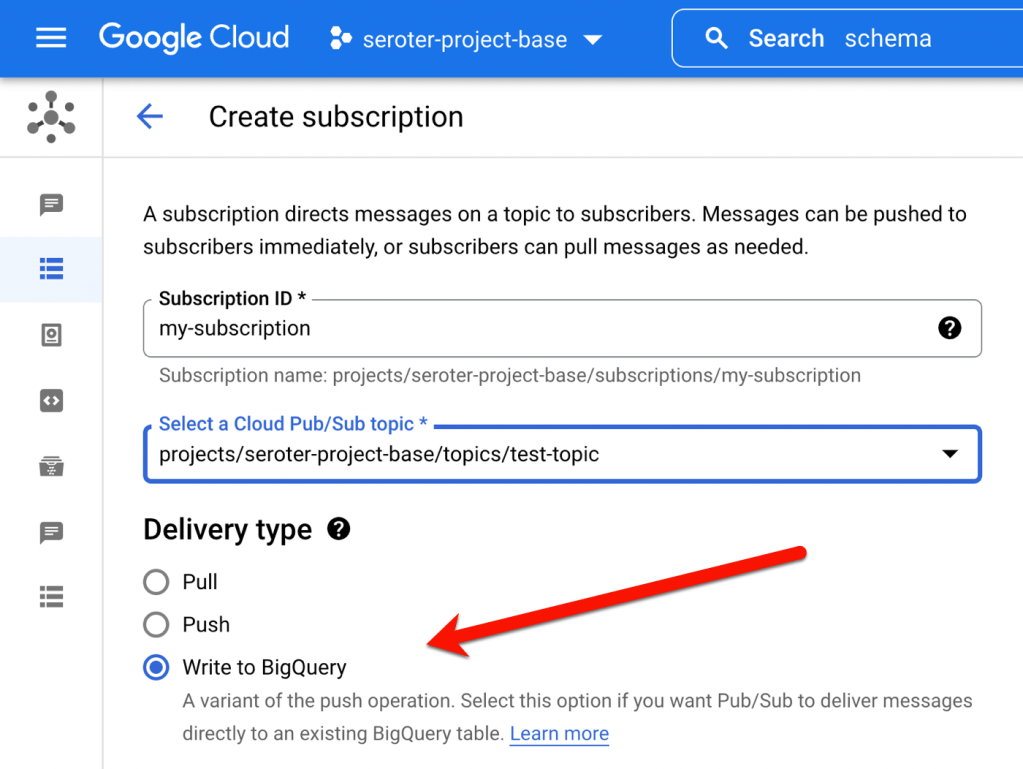
When publishing from Pub/Sub to BigQuery you have a couple of choices for how to handle the data. One option is to dump the entire payload into a single “data” field, which doesn’t sound exciting. The other option is to use a Pub/Sub schema so that the data fields map directly to BigQuery table columns. That’s better. I navigated to the Pub/Sub “Schemas” dashboard and created a new schema.
If kids are following along at home, the full schema looks like this:
We’re almost there. Now we just needed to create the actual Pub/Sub topic and subscription. I defined a new topic named “pets-topic”, and selected the box to “use a schema.” Then I chose the schema we created above.
Now for the subscription itself. As you see below, there’s a “delivery type” for “Write to BigQuery” which is super useful. Once I chose that, I was asked for the dataset and table, and I chose the option to “use topic schema” so that the message body would map to the individual columns in the table.
This is still a “regular” Pub/Sub subscription, so if I wanted to, I could set properties like message retention duration, expiration period, subscription filters, and retry policies.
Nothing else to it. And we did it all from the Cloud Console. To test this out, I went to my topic in the Cloud Console, and chose to send a message. Here, I sent a single message that conformed to the topic schema.
Almost immediately, my BigQuery table got updated and I saw the new data in my query results.
When I searched online, I saw various ways that people have stitched together their (cloud) messaging engines with their data warehouse. But from what I can tell, what we did here is the simplest, most-integrated way to pull that off. Try it out and tell me what you think!
I have a love/hate relationship with workflow technologies after 20+ years of working with them. On the plus side, these technologies often provide a good way to quickly model a process without having to code a bunch of boilerplate stuff. And a good workflow runtime handles the complex stuff like starting up a workflow instance, saving state when the workflow is long-running, and enabling things like retries for failed instances. The downside of workflow tech? You’re often wrangling clumsy design interfaces, stitching together multiple components to achieve something you could have solved with a single line of code, and stuck using unique domain-specific languages (DSLs) with zero (or limited) portability. I get why some folks build workflow solutions out of databases and background workers! But maybe there’s something better.
Last year, Google Cloud (where I work) shipped Cloud Workflows. It’s a fully managed design and runtime service where you only pay when a workflow is running. Basically, you’d use Cloud Workflows to run event-based or scheduled processes that coordinate web endpoints (serverless functions, REST APIs) or managed services (databases, AI/ML services). It’s similar to AWS Step Functions, and somewhat like Azure Logic Apps. We just added support for parallel processing, and it’s a very smart implementation. Let’s take a look at examples that you can try out for free.
First, here are five things that I like about Cloud Workflows:
Declarative format. Write Workflows in YAML or JSON and get a visual representation. I like this model versus fighting a graphical UI that buries settings or overwhelms the user with millions of options.
Event-driven triggers. Cloud Workflows integrates with Eventarc, the eventing subsystem that sends messages based on things happening within Google Cloud (e.g. object loaded into storage bucket, database backup completed).
Built-in connectors. A connector makes it easier to talk to Google Cloud services from a Workflow. Set a few properties on a connector without learning the full service API.
Production-ready serverless. Cloud Workflows is compliant with a number of certifications and standards. Like Step Functions, Cloud Workflows is a purely managed service that’s pay-as-you-go and scales automatically. Azure Logic Apps offers this approach as well (“consumption plan”), but only recommends it for dev/test. Rather, they encourage single tenancy for their service.
A mix of sophisticated and basic operations. Cloud Workflows does some powerful things like automatic type conversion, callbacks for long-running processes, handling errors and retries, and even invoking private endpoints. But it also does things that SHOULD be easy (but aren’t always easy in other workflow engines), like defining and using variables and writing out logs. You can do a lot before you HAVE to jump into code.
One of those sophisticated operations in a workflow is parallel processing. That is, executing more than one blocking call at the same time. This is a sneaky-hard problem to solve in a workflow engine, especially when it comes to shared data. Can both parallel branches see and access the same data? How to avoid collisions? With AWS Step Functions, they’ve gotten around this problem by passing data by value (not reference) into a branch and not allowing state transfers between branches. Cloud Workflows takes a different approach to data in parallel branches. With our implementation, you define “shared variables” that are available to any and all branches that run concurrently. We handle the atomic updates for you and data changes are immediately available to other branches. Pretty cool!
Example #1 – Basic Cloud Workflow
How about we start out with something straightforward. Here, I declared a few variables up front, added a log message, then a switch statement which called one of two steps before sending a result.
#basic starter workflow
- step1:
   #define and assign variables for use in the workflow
   assign:
    - var1: 100           #can be numbers
    - var2: "Richard"     #can be text
    - var3: "SAN"
    - var4:               #can be instantiated as null
    - var5: ~             #this is null as well
    - varlist: ["item1"]  #how about a list too?
- step2:
   call: sys.log          #call to standard library to write a log message
   args:
     data: ${var2}
- step3:
   switch:                #control flow example
     - condition: ${var3 == "SAN"}
       next: dostuff1
     - condition: true
       next: dostuff2
   next: final
- dostuff1:
   assign:
     - var4: "full-time employee"
     - varlist: ${list.concat(varlist, "item2")}  #add item to list
   next: final
- dostuff2:
   assign:
     - var4: "part-time employee"
     - varlist: ${list.concat(varlist, "item3")}  #add item to list
   next: final
- final:
   return: ${varlist}     #the result of the workflow itself
Here’s the generated visual representation of this workflow.
After deploying the workflow, I chose the in-console option to execute the workflow. You can see that I have the option to provide input values. And I chose to log all the calls, which makes it easier to trace what’s going on.
When I execute the workflow, I get a live update to the logs, and the output itself. It’s a helpful interface.
Example #2 – Workflow with parallel processing and read-only variables
How about we try a workflow with concurrent branches? It uses the “parallel” control flow action, and I defined a pair of branches that each log a message. Notice that each one can access the “var1” variable. Read-only access to a global variable doesn’t require anything special.
# basic parallel steps that work, can read variables without marking as shared
- step1:
   assign:
    - var1: 100
    - var2: 200
- step2:
   call: sys.log
   args:
     data: ${var1}
- step3:
   parallel:              #indicate parallel processing ahead
     branches:
       - branch1:         #first branch which can access var1 declared above
           steps:
             - dostuff:
                call: sys.log
                args:
                  text: ${"log message " + string(var1)}
       - branch2:         #second branch which access the same variable
           steps:
             - dostuff2:
                call: sys.log
                args:
                  data: ${var1}
- final:
   return: ${var1}
The visual representation of parallel branches looks like this.
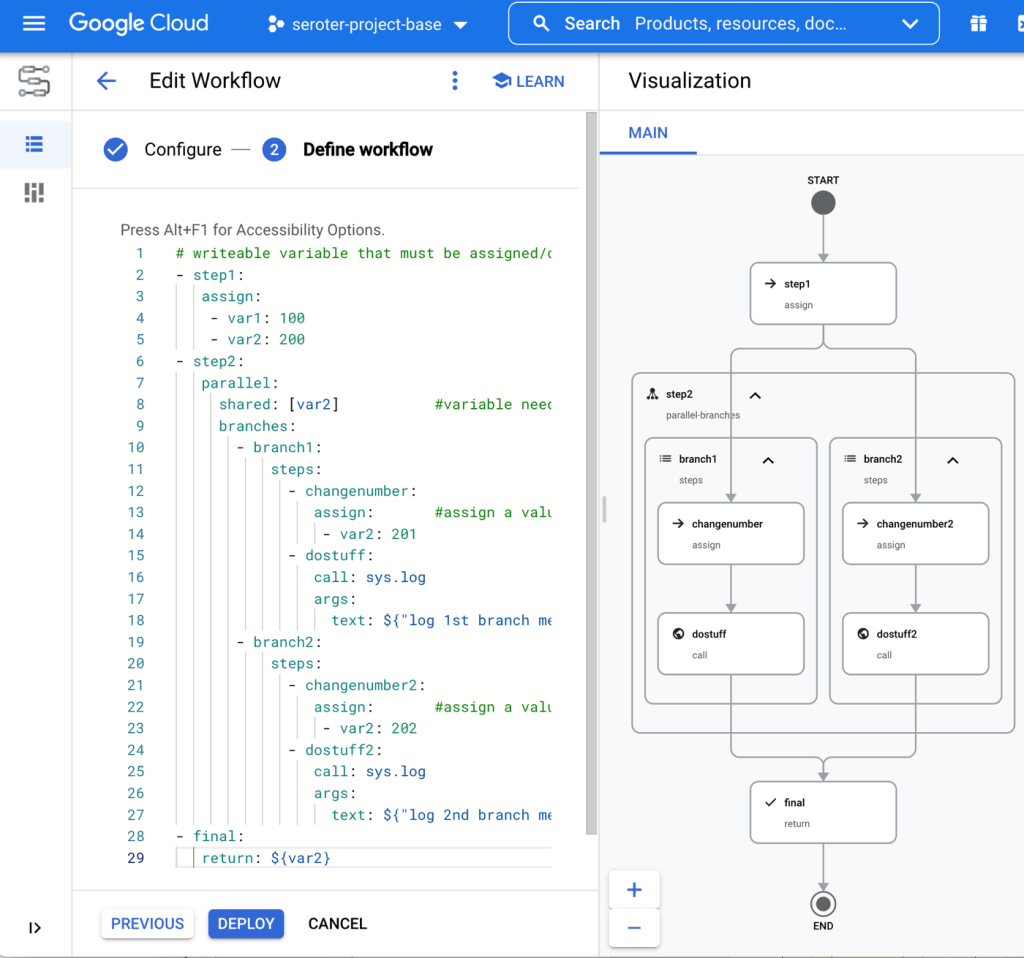
Example #3 – Workflow with shared, writable variable
The above workflow throws an error if I try to assign a value to that global variable from within a branch. What if I want one or more branches to update a shared variable? It could be a counter, an array, or something else. In this scenario, each branch sets a value. These branches aren’t guaranteed to run in any particular order, so if you run this workflow a few times, you’ll see different final values for “var2.”
# writeable variable that must be assigned/declared first before indicated as "shared"
- step1:
   assign:
    - var1: 100
    - var2: 200
- step2:
   parallel:
     shared: [var2]           #variable needs to be declared earlier to be "shared" here
     branches:
       - branch1:
           steps:
             - changenumber:
                assign:       #assign a value to the shared variable
                 - var2: 201
             - dostuff:
                call: sys.log
                args:
                  text: ${"log 1st branch message " + string(var2)}
       - branch2:
           steps:
             - changenumber2:
                assign:       #assign a value to the shared variable
                 - var2: 202
             - dostuff2:
                call: sys.log
                args:
                  text: ${"log 2nd branch message " + string(var2)}
- final:
   return: ${var2}
The workflow looks like this when visualized. You can see the multiple actions per branch.
Example #4 – Workflow with shared array that’s updated within each parallel branch
An array is a type of variable in a Cloud Workflow. What if you wanted to append an item to an array from within each branch of an array? That might be tricky with some engines, but it’s straightforward here.
The representation is similar to the one above, but we can see when executing the workflow that the output array has a pair of names added to it.
This is a relatively simple way to append data to a shared object, even when running in a distributed, parallelized workflow.
Example #5 – Workflow with map updated with values from each parallel branch
There’s another way to do this. If you wanted to collect different data points from each branch, and then smash them into a composite object when all the branches complete, it’s not too hard. Here, I scatter and then gather.
# separate messages per branch, joined at the end
- step1:
   assign:
    - var1: ~
    - var2: ~
    - var3: {} #declare a map
- step2:
   parallel:
     shared: [var1, var2]  #still need shared variables in order to be writable in a branch
     branches:
       - branch1:
           steps:
             - getval1:
                assign:
                 - var1: "value1"
             - log1:
                call: sys.log
                args:
                  text: ${"log 1st branch message "}
       - branch2:
           steps:
             - getval2:
                assign:
                 - var2: "value2"
             - log2:
                call: sys.log
                args:
                  text: ${"log 2nd branch message "}
- gathervalues:
   assign:                 #set key/value pairs on the map object
      - var3.val1: ${var1}
      - var3.val2: ${var2}
- final:
   return: ${var3}
This could be useful in a few cases, and you can see the visual representation here.
When I call this workflow, I get back a map with a pair of key/value properties.
Example #6 – Workflow with parallel loop that updates a map variable with each iteration
You can do more than just parallel branches in a Cloud Workflow. You can also do parallelized loops. That means that multiple iterations can execute concurrently. Neat!
For this scenario, let’s imagine that I want to pull employee data from three different systems, and return it all as one composite object. To stub this out, I built a Cloud Function that takes in “system ID” via the querystring and returns some fixed data based on which system ID comes in. It’s contrived, but does the job.
exports.systemLookup = (req, res) => {

  var systemid = req.query.id;
  var payload;

  switch(systemid) {
    case "e1":
      payload = {name: "Richard Seroter", location: "SAN"};
      break;
    case "d1":
      payload = {department: "PM", tenure: "2.2yrs"};
      break;
    case "r1":
      payload = {latestperfrating: "3"};
      break;
    default:
      payload = {type: "employee"}
      break;
  }
  res.status(200).send(payload);
};
After I deployed this function, I built this workflow which loops through a list of employee system names and calls this Function for each one. And then takes the result and adds it to the map variable.
# parallel loop that calls a function and builds up a composite object
- step1:
   assign:
    - systemlist: ["e1", "d1", "r1"]   #list of employee systems to retrieve data from
    - employeemap: {}                  #map that holds composite result
- step2:
   parallel:
     shared: [systemlist, employeemap] #still need shared variables in order to be writable in a branch
     for:            #loop
      value: systemid
      in: ${systemlist}
      steps:
         - getEmpDetails:
            call: http.get    #call function
            args:
               url: ${"https://[host]/function-lookupfromworkflow?id=" + systemid}
            result: payload
         - logmsg:
            call: sys.log
            args:
               text: ${"log loop message " + systemid}
         - append:
            assign:           #assign the result to the map
               - employeemap[systemid]: ${payload.body}
- final:
   return: ${employeemap}
Such a workflow is visualized as such.
The result? I get a composite object back, and it happened super fast since the engine made Function calls in parallel!
Summary
Cloud Workflows are new in town, but they’re already a solid option. The DSL is powerful and yet elegantly solves tricky distributed systems problems like shared variables. I think you can run all the examples above within the confines of our free tier, which makes it simple to experiment further. Let me know what you think, and what else you’d like to see us add to Cloud Workflows.
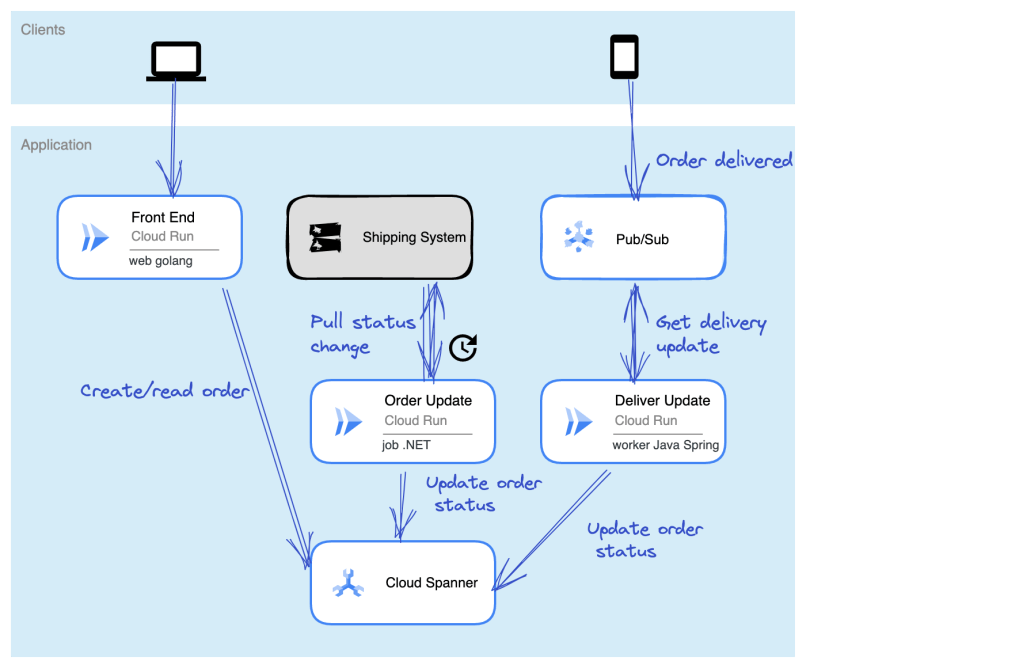
If it seems to you that cloud providers offer distinct compute services for every specific type of workload, you’re not imagining things. Fifteen years ago when I was building an app, my hosting choices included a virtual machine or a physical server. Today? You’ll find services targeting web apps, batch apps, commercial apps, containerized apps, Windows apps, Spring apps, VMware-based apps, and more. It’s a lot. So, it catches my eye when I find a modern cloud service that support a few different types of workloads. Our serverless compute service Google Cloud Run might be the fastest and easiest way to get web apps running in the cloud, and we just added support for background jobs. I figured I’d try out Cloud Run for three distinct scenarios: web app (responds to HTTP requests, scales to zero), job (triggered, runs to completion), and worker (processes background work continuously).
Let’s make this scenario come alive. I want a web interface that takes in “orders” and shows existing orders (via Cloud Run web app). There’s a separate system that prepares orders for delivery and we poll that system occasionally (via Cloud Run job) to update the status of our orders. And when the order itself is delivered, the mobile app used by the delivery-person sends a message to a queue that a worker is constantly listening to (via Cloud Run app). The basic architecture is something like this:
Ok, how about we build it out!
Setting up our Cloud Spanner database
The underlying database for this system is Cloud Spanner. Why? Because it’s awesome and I want to start using it more. Now, I should probably have a services layer sitting in front of the database instead of doing direct read/write, but this is my demo and I’ll architect however I damn well please!
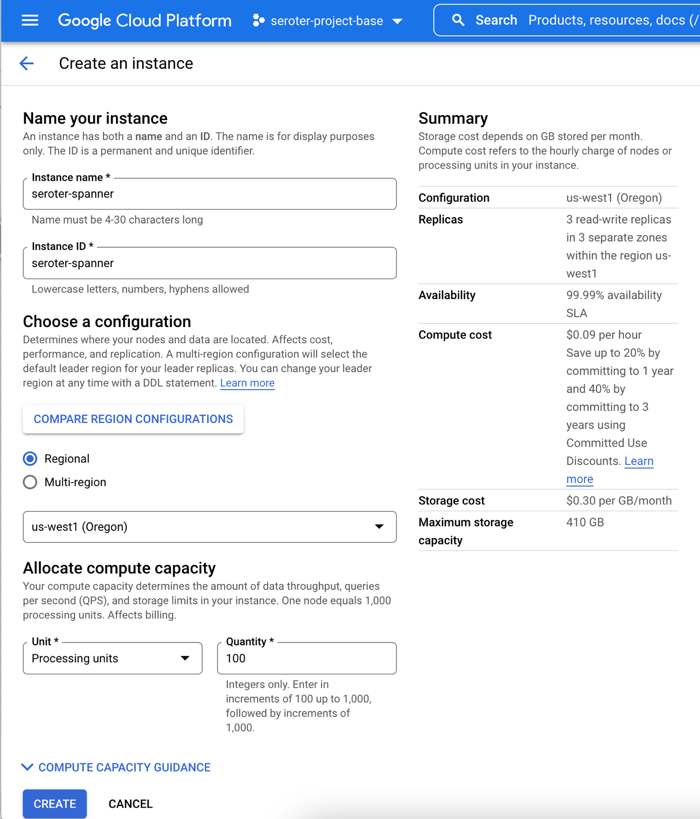
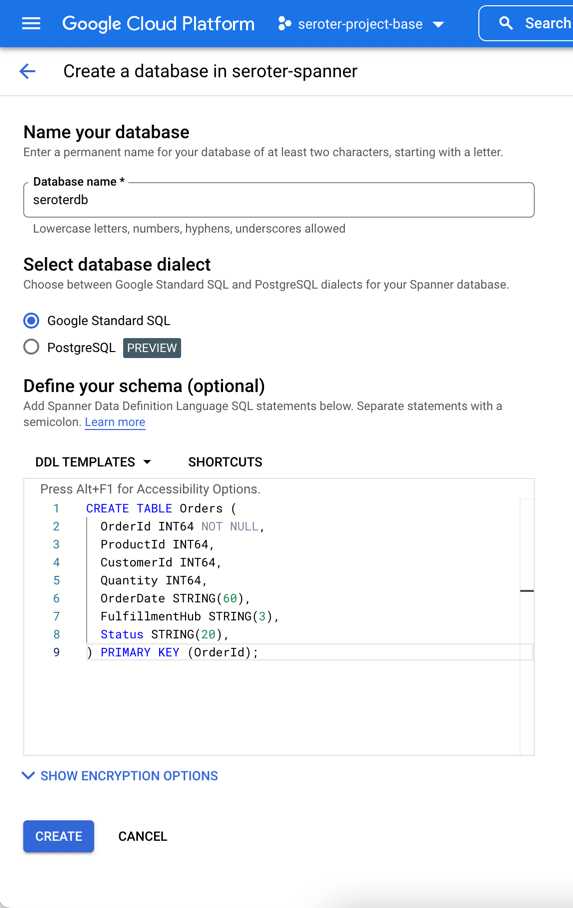
I started by creating a Spanner instance. We’ve recently made it possible to create smaller instances, which means you can get started at less cost, without sacrificing resilience. Regardless of the number of “processing units” I choose, I get 3 replicas and the same availability SLA. The best database in the cloud just got a lot more affordable.
Next, I add a database to this instance. After giving it a name, I choose the “Google Standard SQL” option, but I could have also chosen a PostgreSQL interface. When defining my schema, I like that we offer script templates for actions like “create table”, “create index”, and “create change stream.” Below, you see my table definition.
With that, I have a database. There’s nothing left to do, besides bask in the glory of having a regionally-deployed, highly available relational database instance at my disposal in about 60 seconds.
Creating the web app in Go and deploying to Cloud Run
With the database in place, I can build a web app with read/write capabilities.
This app is written in Go and uses the echo web framework. I defined a basic struct that matches the fields in the database.
package model

type Order struct {
	OrderId        int64
	ProductId      int64
	CustomerId     int64
	Quantity       int64
	Status         string
	OrderDate      string
	FulfillmentHub string
}
I’m using the Go driver for Spanner and the core of the logic consists of the operations to retrieve Spanner data and create a new record. I need to be smarter about reusing the connection, but I’ll refactor it later. Narrator: He probably won’t refactor it.
package web

import (
	"context"
	"log"
	"time"
	"cloud.google.com/go/spanner"
	"github.com/labstack/echo/v4"
	"google.golang.org/api/iterator"
	"seroter.com/serotershop/model"
)

func GetOrders() []*model.Order {

	//create empty slice
	var data []*model.Order

	//set up context and client
	ctx := context.Background()
	db := "projects/seroter-project-base/instances/seroter-spanner/databases/seroterdb"
	client, err := spanner.NewClient(ctx, db)
	if err != nil {
		log.Fatal(err)
	}

	defer client.Close()
    //get all the records in the table
	iter := client.Single().Read(ctx, "Orders", spanner.AllKeys(), []string{"OrderId", "ProductId", "CustomerId", "Quantity", "Status", "OrderDate", "FulfillmentHub"})

	defer iter.Stop()

	for {
		row, e := iter.Next()
		if e == iterator.Done {
			break
		}
		if e != nil {
			log.Println(e)
		}

		//create object for each row
		o := new(model.Order)

		//load row into struct that maps to same shape
		rerr := row.ToStruct(o)
		if rerr != nil {
			log.Println(rerr)
		}
		//append to collection
		data = append(data, o)

	}
	return data
}

func AddOrder(c echo.Context) {

	//retrieve values
	orderid := c.FormValue("orderid")
	productid := c.FormValue("productid")
	customerid := c.FormValue("customerid")
	quantity := c.FormValue("quantity")
	status := c.FormValue("status")
	hub := c.FormValue("hub")
	orderdate := time.Now().Format("2006-01-02")

	//set up context and client
	ctx := context.Background()
	db := "projects/seroter-project-base/instances/seroter-spanner/databases/seroterdb"
	client, err := spanner.NewClient(ctx, db)
	if err != nil {
		log.Fatal(err)
	}

	defer client.Close()

	//do database table write
	_, e := client.Apply(ctx, []*spanner.Mutation{
		spanner.Insert("Orders",
			[]string{"OrderId", "ProductId", "CustomerId", "Quantity", "Status", "FulfillmentHub", "OrderDate"},
			[]interface{}{orderid, productid, customerid, quantity, status, hub, orderdate})})

	if e != nil {
		log.Println(e)
	}
}
Time to deploy! I’m using Cloud Build to generate a container image without using a Dockerfile. A single command triggers the upload, build, and packaging of my app.
After a moment, I have a container image ready to go. I jumped in the Cloud Run experience and chose to create a new service. After picking the container image I just created, I kept the default autoscaling (minimum of zero instances), concurrency, and CPU allocation settings.
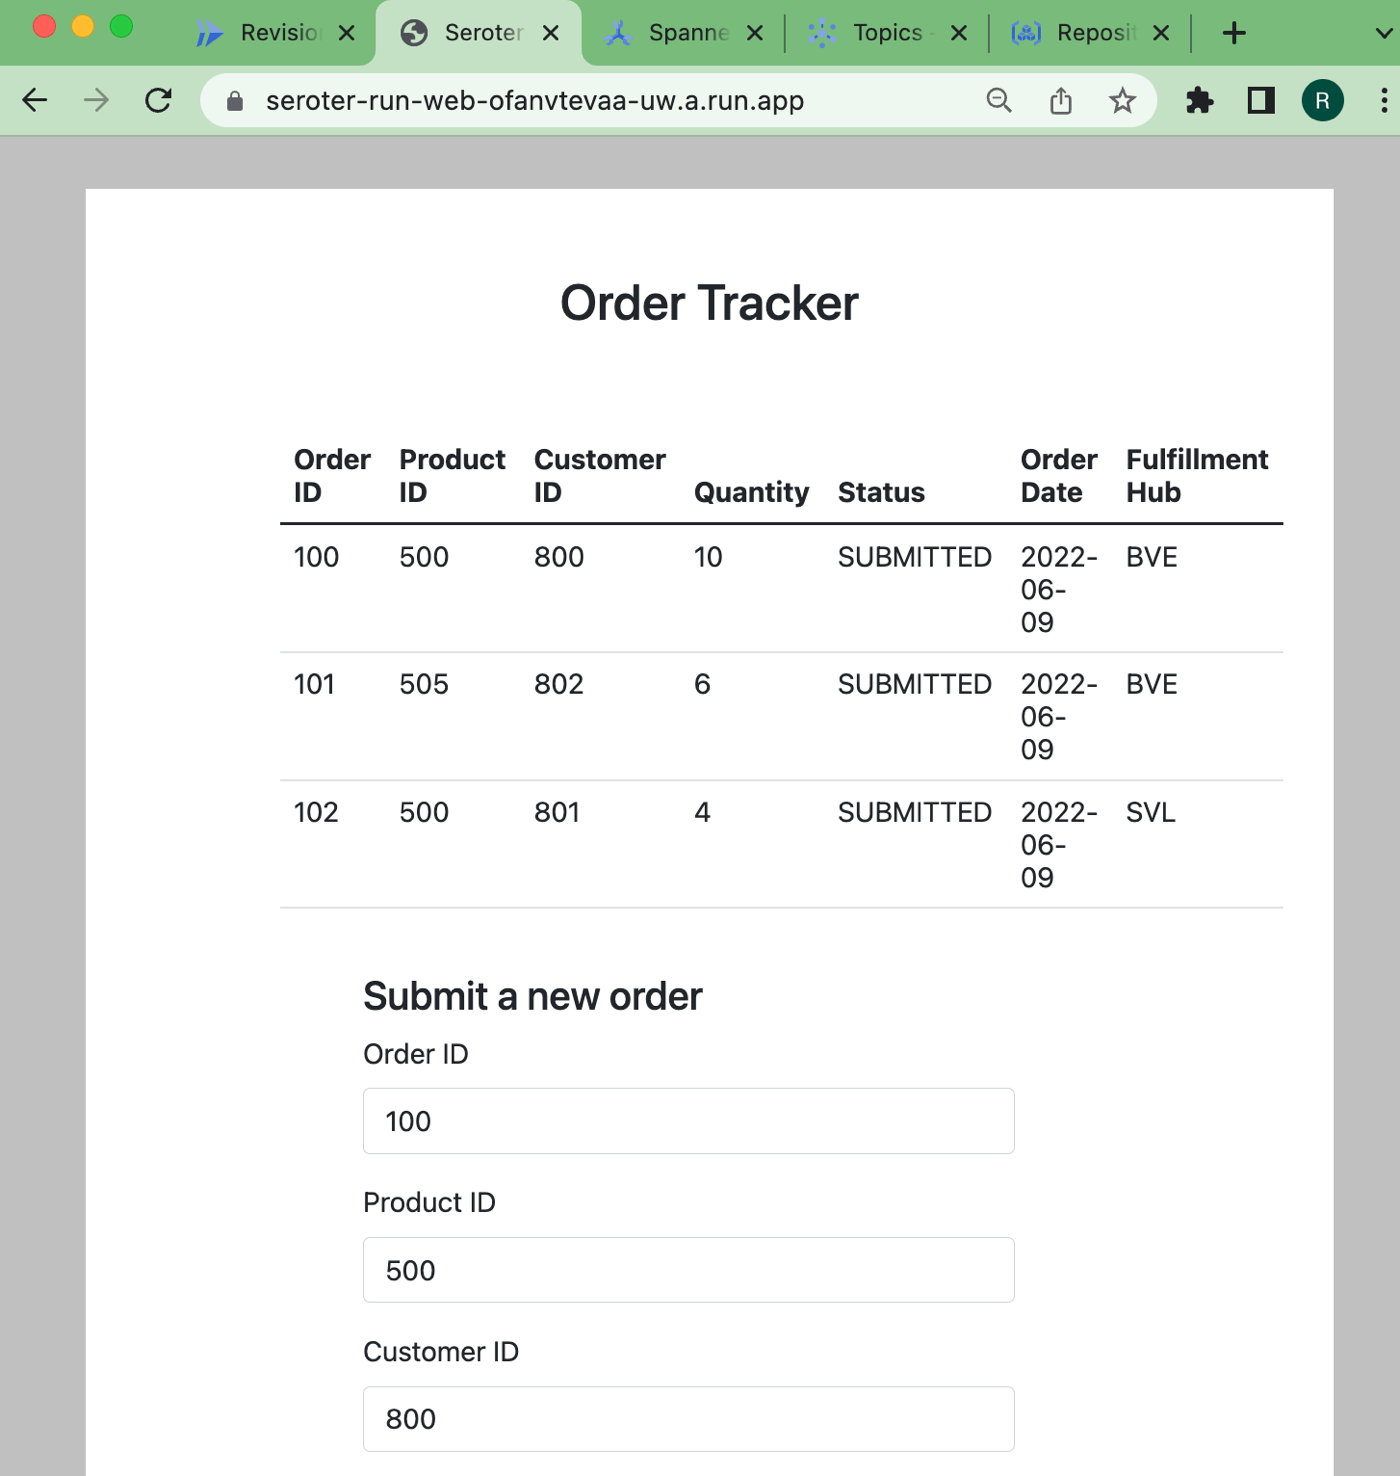
The app started in seconds, and when I call up the URL, I see my application. And I went ahead and submitted a few orders, which then show up in the list.
Checking Cloud Spanner—just to ensure this wasn’t only data sitting client-side—shows that I have rows in my database table.
Ok, my front end web application is running (when requests come in) and successfully talking to my Cloud Spanner database.
Creating the batch processor in .NET and deploying to Cloud Run jobs
As mentioned in the scenario summary, let’s assume we have some shipping system that prepares the order for delivery. Every so often, we want to poll that system for changes, and update the order status in the Spanner database accordingly.
Until lately, you’d run these batch jobs in App Engine, Functions, a GKE pod, or some other compute service that you could trigger on a schedule. But we just previewed Cloud Run jobs which offers a natural choice moving forward. Here, I can run anything that can be containerized, and the workload runs until completion. You might trigger these via Cloud Scheduler, or kick them off manually.
Let’s write a .NET console application that does the work. I’m using the new minimal API that hides a bunch of boilerplate code. All I have is a Program.cs file, and a package dependency on Google.Cloud.Spanner.Data. Because I don’t like you THAT much, I didn’t actually create a stub for the shipping system, and decided to update the status of all the rows at once.
using Google.Cloud.Spanner.Data;

Console.WriteLine("Starting job ...");

//connection string
string conn = "Data Source=projects/seroter-project-base/instances/seroter-spanner/databases/seroterdb";

using (var connection = new SpannerConnection(conn)) {

    //command that updates all rows with the initial status
    SpannerCommand cmd = connection.CreateDmlCommand("UPDATE Orders SET Status = 'SHIPPED' WHERE Status = 'SUBMITTED'");

    //execute and hope for the best
    cmd.ExecuteNonQuery();
}

//job should end after this
Console.WriteLine("Update done. Job completed.");
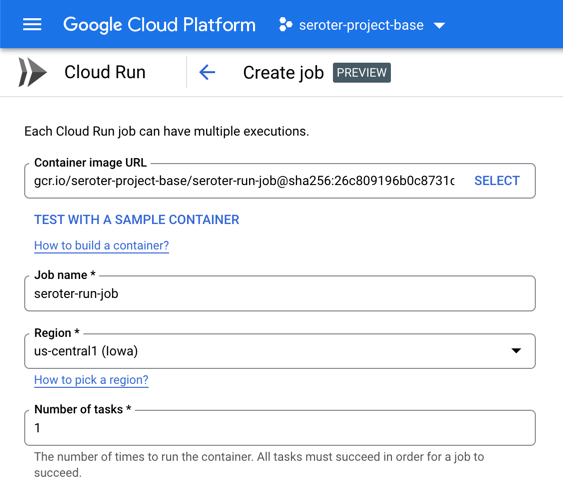
Like before, I use a single Cloud Build command to compile and package my app into a container image: gcloud builds submit --pack image=gcr.io/seroter-project-base/seroter-run-job
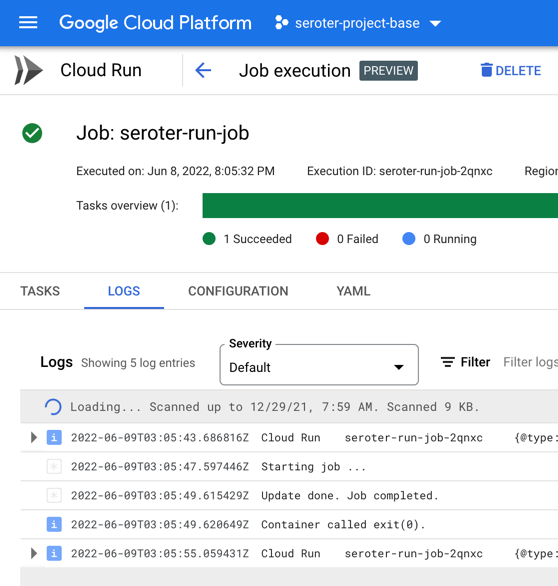
Let’s go back into the Cloud Run interface, where we just turned on a UI for creating and managing jobs. I start by choosing my just-now-created container image and keeping the “number of tasks” to 1.
For reference, there are other fun “job” settings. I can allocate up to 32GB of memory and 8 vCPUs. I can set the timeout (up to an hour), choose how much parallelism I want, and even select the option to run the job right away.
After creating the job, I click the button that says “execute” and run my job. I see job status and application logs, updated live. My job succeeded!
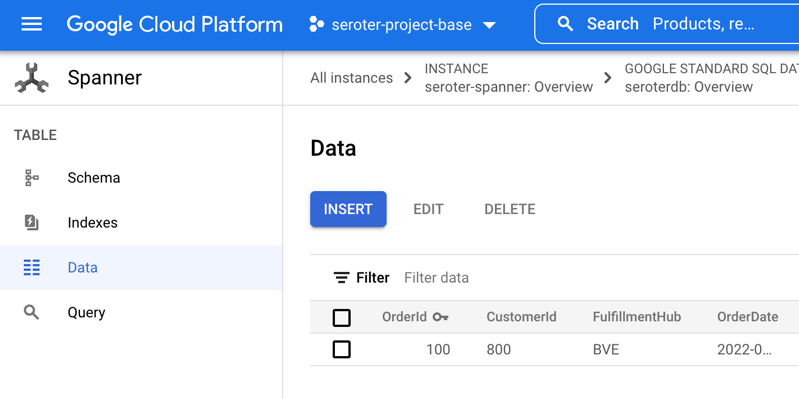
Checking Cloud Spanner confirms that my all table rows were updated to a status of “SHIPPED”.
It’s great that I didn’t have to leave the Cloud Run API or interface to build this batch processor. Super convenient!
Creating the queue listener in Spring and deploying to Cloud Run
The final piece of our architecture requires a queue listener. When our delivery drivers drop off a package, their system sends a message to Google Cloud Pub/Sub, our pretty remarkable messaging system. To be sure, I could trigger Cloud Run (or Cloud Functions) automatically whenever a message hits Pub/Sub. That’s a built-in capability. I don’t need to use a processor that directly pulls from the queue.
But maybe I want to control the pull from the queue. I could do stateful processing over a series of messages, or pull batches instead of one-at-a-time. Here, I’m going to use Spring Cloud Stream which talks to any major messaging system and triggers a function whenever a message arrives.
Also note that Cloud Run doesn’t explicitly support this worker pattern, but you can make it work fairly easily. I’ll show you.
I went to start.spring.io and configured my app by choosing a Spring Web and GCP Support dependency. Why “web” if this is a background worker? Cloud Run still expects a workload that binds to a web port, so we’ll embed a web server that’s never used.
After generating the project and opening it, I deleted the “GCP support” dependency (I just wanted an auto-generated dependency management value) and added a couple of POM dependencies that my app needs. The first is the Google Cloud Pub/Sub “binder” for Spring Cloud Stream, and the second is the JDBC driver for Cloud Spanner.
I then created an object definition for “Order” with the necessary fields and getters/setters. Let’s review the primary class that does all the work. The way Spring Cloud Stream works is that reactive functions annotated as beans are invoked when a message comes in. The Spring machinery wires up the connection to the message broker and does most of the work. In this case, when I get an order message, I update the order status in Cloud Spanner to “DELIVERED.”
package com.seroter.runworker;


import java.util.function.Consumer;
import org.springframework.boot.SpringApplication;
import org.springframework.boot.autoconfigure.SpringBootApplication;
import org.springframework.context.annotation.Bean;
import reactor.core.publisher.Flux;
import java.sql.Connection;
import java.sql.DriverManager;
import java.sql.Statement;
import java.sql.SQLException;

@SpringBootApplication
public class RunWorkerApplication {

	public static void main(String[] args) {
		SpringApplication.run(RunWorkerApplication.class, args);
	}

	//takes in a Flux (stream) of orders
	@Bean
	public Consumer<Flux<Order>> reactiveReadOrders() {

		//connection to my database
		String connectionUrl = "jdbc:cloudspanner:/projects/seroter-project-base/instances/seroter-spanner/databases/seroterdb";

		return value ->
			value.subscribe(v -> {
				try (Connection c = DriverManager.getConnection(connectionUrl); Statement statement = c.createStatement()) {
					String command = "UPDATE Orders SET Status = 'DELIVERED' WHERE OrderId = " + v.getOrderId().toString();
					statement.executeUpdate(command);
				} catch (SQLException e) {
					System.out.println(e.toString());
				}
			});
	}
}
My corresponding properties file has the few values Spring Cloud Stream needs to know about. Specifically, I’m specifying the Pub/Sub topic, indicating that I can take in batches of data, and setting the “group” which corresponds to the topic subscription. What’s cool is that if these topics and subscriptions don’t exist already, Spring Cloud Stream creates them for me.
For the final time, I run the Cloud Build command to build and package my Java app into a container image: gcloud builds submit --pack image=gcr.io/seroter-project-base/seroter-run-worker
With this container image ready to go, I slide back to the Cloud Run UI and create a new service instance. This time, after choosing my image, I choose “always allocated CPU” to ensure that the CPU stays on the whole time. And I picked a minimum instance of one so that I have a single always-on worker pulling from Pub/Sub. I also chose “internal only” traffic and require authentication to make this harder for someone to randomly invoke.
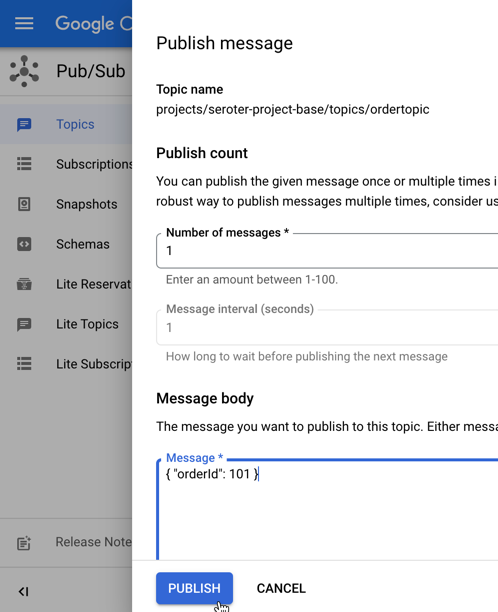
My service quickly starts up, and upon initialization, creates both the topic and queue for my app.
I go into the Pub/Sub UI where I can send a message directly into a topic. All I need to send in is a JSON payload that holds the order ID of the record to update.
The result? My database record is updated, and I see this by viewing my web application and noticing the second row has a new “status” value.
Wrap up
Instead of using two or three distinct cloud compute services to satisfy this architecture, I used one. Cloud Run defies your expectations of what serverless can be, especially now that you can run serverless jobs or even continuously-running apps. In all cases, I have no infrastructure to provision, scale, or manage.
You can use Cloud Run, Pub/Sub, and Cloud Build with our generous free tier, and Spanner has never been cheaper to try out. Give it a whirl, and tell me what you think of Cloud Run jobs.
Do you like using function-as-a-service (FaaS) platforms to quickly build scalable systems? Me too. There are constraints around what you can do with FaaS, which is why I also like this new crop of container-based serverless compute services. These products—the terrific Google Cloud Run is the most complete example and has a generous free tier—let you deploy more full-fledged “apps” versus the glue code that works best in FaaS. Could be a little Go app, full-blown Spring Boot REST API, or a Redis database. Sounds good, but what if you don’t want to mess with containers as you build and deploy software? Or are concerned about the “cold start” penalty of a denser workload?
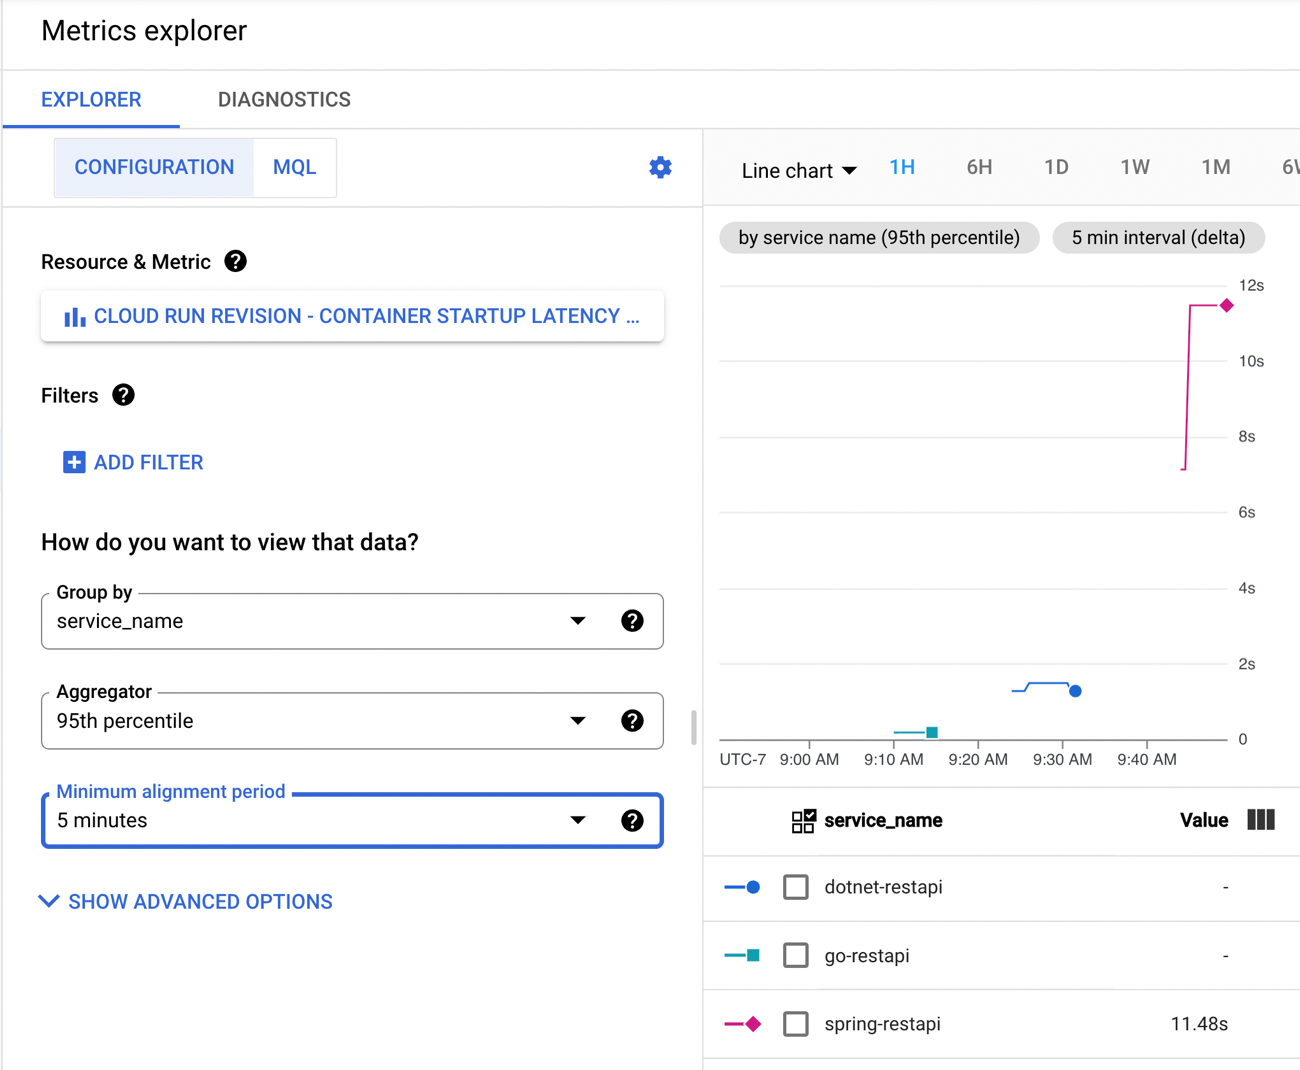
Google Cloud has embraced Cloud Buildpacks as a way to generate a container image from source code. Using our continuous integration service or any number of compute services directly, you never have to write a Dockerfile again, unless you want to. Hopefully, at least. Regarding the cold start topic, we just shipped a new cloud metric, “container startup latency” to measure the time it takes for a serverless instance to fire up. That seems like a helpful tool to figure out what needs to be optimized. Based on these two things, I got curious and decided to build the same REST API in four different programming languages to see how big the generated container image was, and how fast the containers started up in Cloud Run.
Since Cloud Run accepts most any container, you have almost limitless choices in programming language. For this example, I chose to use C#, Go, Java (Spring Boot), and JavaScript (Node.js). I built an identical REST API with each. It’s entirely possible, frankly likely, that you could tune these apps much more than I did. But this should give us a decent sense of how each language performs.
Let’s go language-by-language and review the app, generate the container image, deploy to Cloud Run, and measure the container startup latency.
Go
I’m almost exclusively coding in Go right now as I try to become more competent with it. Go has an elegant simplicity to it that I really enjoy. And it’s an ideal language for serverless environments given its small footprint, blazing speed, and easy concurrency.
For the REST API, which basically just returns a pair of “employee” records, I used the Echo web framework and Go 1.18.
My data model (struct) has four properties.
package model

type Employee struct {
	Id       string `json:"id"`
	FullName string `json:"fullname"`
	Location string `json:"location"`
	JobTitle string `json:"jobtitle"`
}
My web handler offers a single operation that returns two employee items.
And finally, the main Go class spins up the web server.
package main

import (
	"fmt"

	"github.com/labstack/echo/v4"
	"github.com/labstack/echo/v4/middleware"
	"seroter.com/restapi/web"
)

func main() {
	fmt.Println("server started ...")

	e := echo.New()
	e.Use(middleware.Logger())

	e.GET("/employees", web.GetAllEmployees)

	e.Start(":8080")
}
Next, I used Google Cloud Build along with Cloud Buildpacks to generate a container image from this Go app. The buildpack executes a build, brings in a known good base image, and creates an image that we add to Google Cloud Artifact Registry. It’s embarrassingly easy to do this. Here’s the single command with our gcloud CLI:
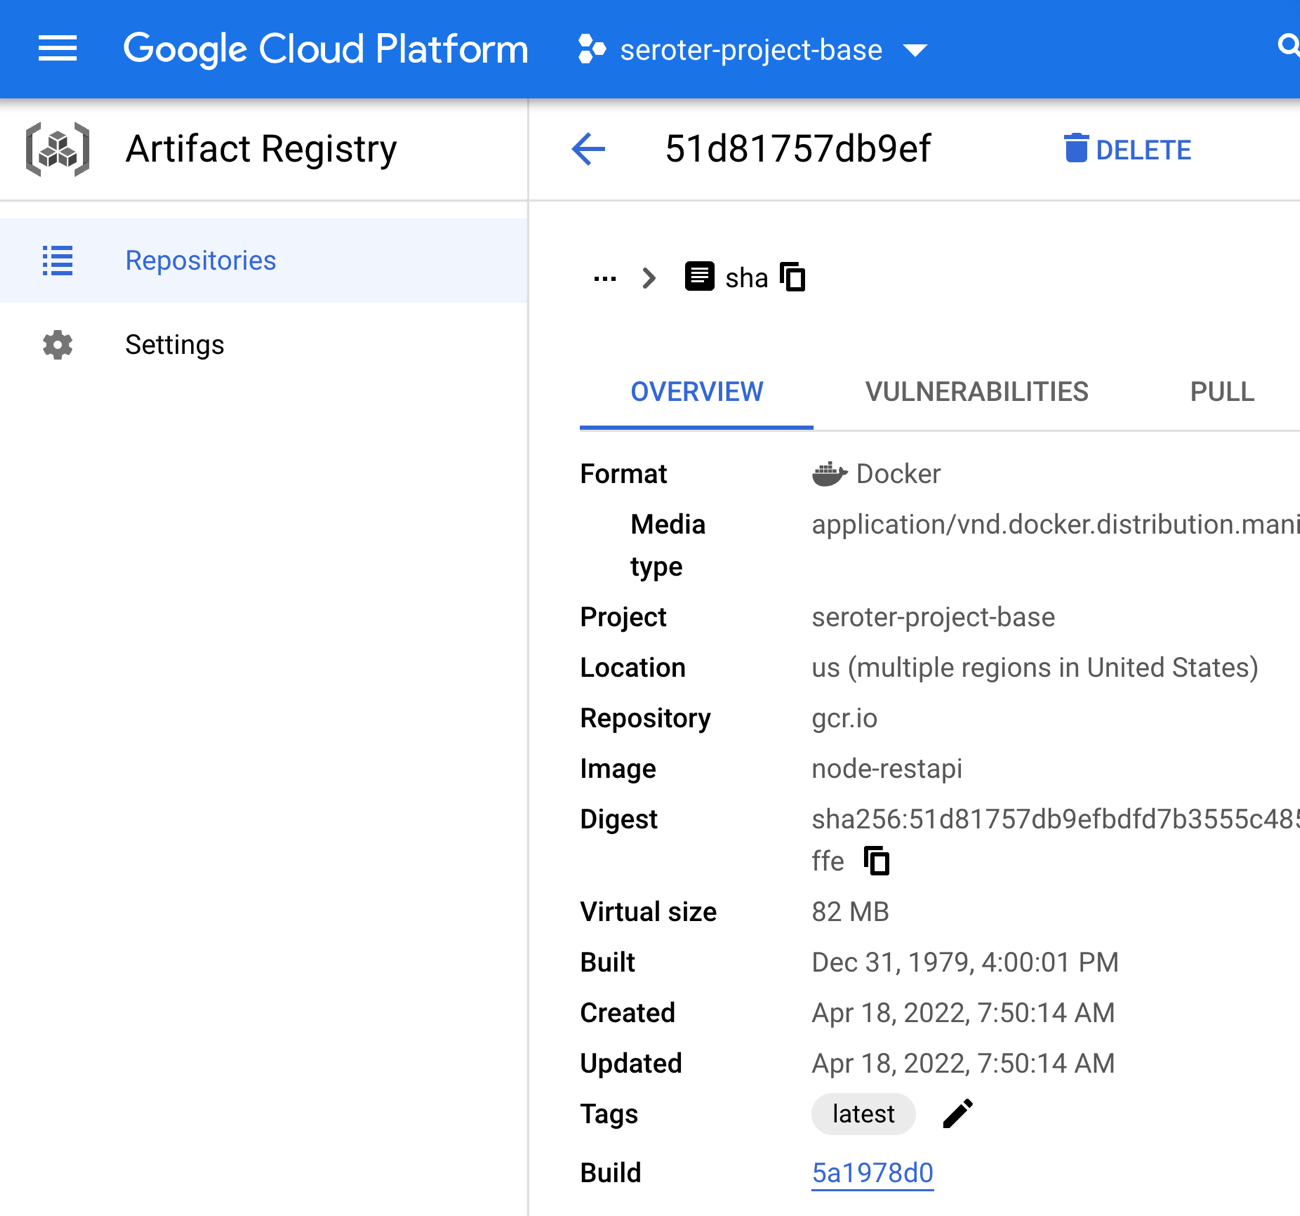
The result? A 51.7 MB image in my Docker repository in Artifact Registry.
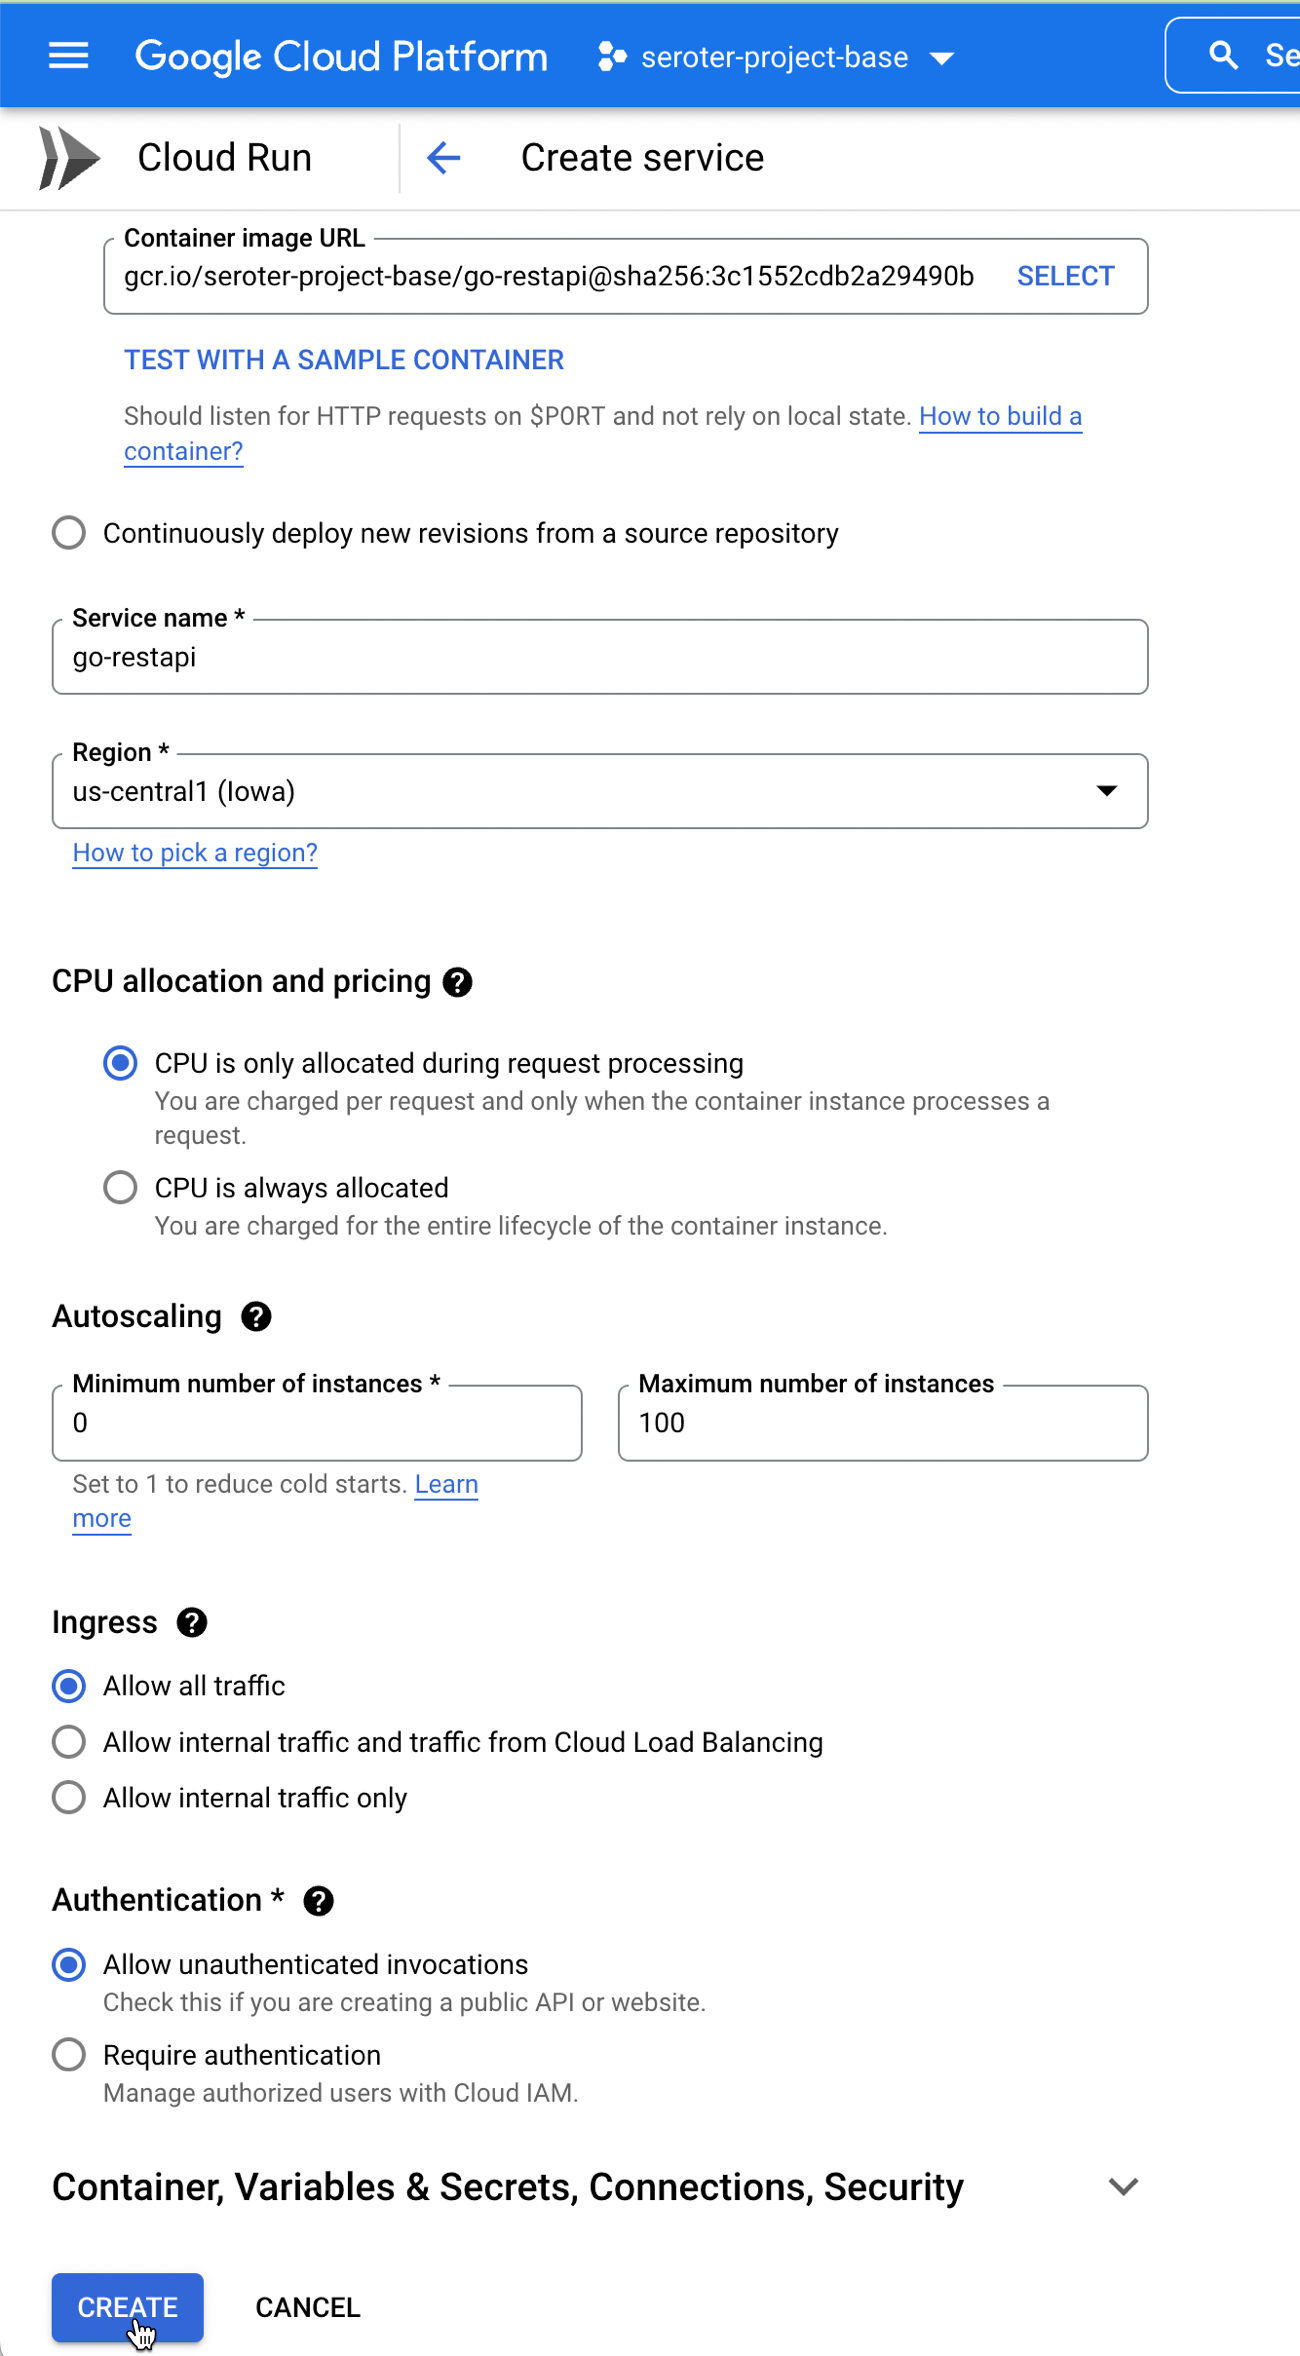
The last step was to deploy to Cloud Run. We could use the CLI of course, but let’s use the Console experience because it’s delightful.
After pointing at my generated container image, I could just click “create” and accept all the default instance properties. As you can see below, I’ve got easy control over instance count (minimum of zero, but you can keep a warm instance running if you want).
Let’s tweak a couple of things. First off, I don’t need the default amount of RAM. I can easily operate with just 256MiB, or even less. Also, you see here that we default to 80 concurrent requests per container. That’s pretty cool, as most FaaS platforms do a single concurrent request. I’ll stick with 80.
It seriously took four seconds from the time I clicked “create” until the instance was up and running and able to take traffic. Bonkers. I didn’t send any initial requests in, as I want to hit it cold with a burst of data. I’m using the excellent hey tool to generate a bunch of load on my service. This single command sends 200 total requests, with 10 concurrent workers.
Here’s the result. All the requests were done in 2.6 seconds, and you can see that that the first ones (as the container warmed up) took 1.2 seconds, and the vast majority took 0.177 seconds. That’s fast.
Summary:
  Total:        2.6123 secs
  Slowest:      1.2203 secs
  Fastest:      0.0609 secs
  Average:      0.1078 secs
  Requests/sec: 76.5608

  Total data:   30800 bytes
  Size/request: 154 bytes

Response time histogram:
  0.061 [1]     |
  0.177 [189]   |■■■■■■■■■■■■■■■■■■■■■■■■■■■■■■■■■■■■■■■■
  0.293 [0]     |
  0.409 [0]     |
  0.525 [1]     |
  0.641 [6]     |■
  0.757 [0]     |
  0.873 [0]     |
  0.988 [0]     |
  1.104 [0]     |
  1.220 [3]     |■


Latency distribution:
  10% in 0.0664 secs
  25% in 0.0692 secs
  50% in 0.0721 secs
  75% in 0.0777 secs
  90% in 0.0865 secs
  95% in 0.5074 secs
  99% in 1.2057 secs
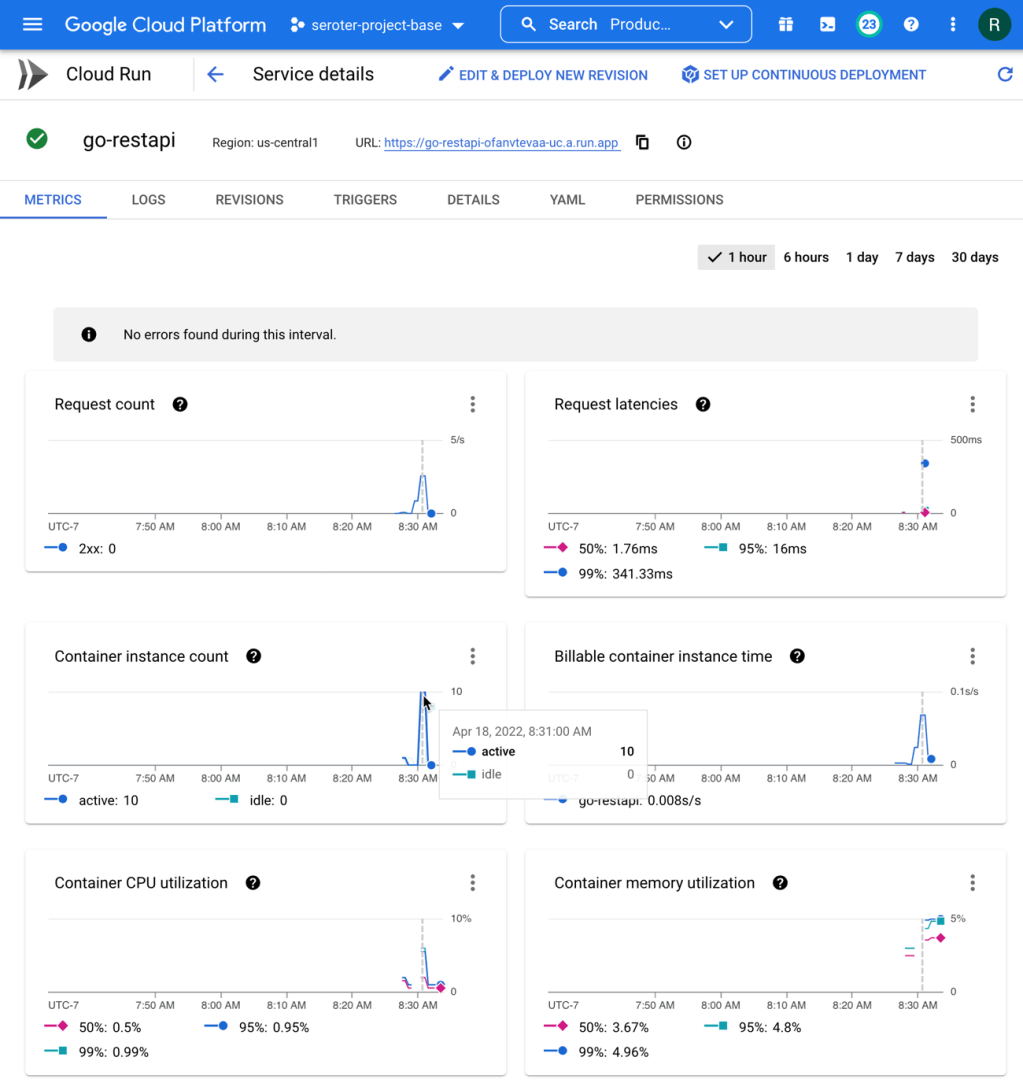
How about the service metrics? I saw that Cloud Run spun up 10 containers to handle the incoming load, and my containers topped out at 5% memory utilization. It also barely touched the CPU.
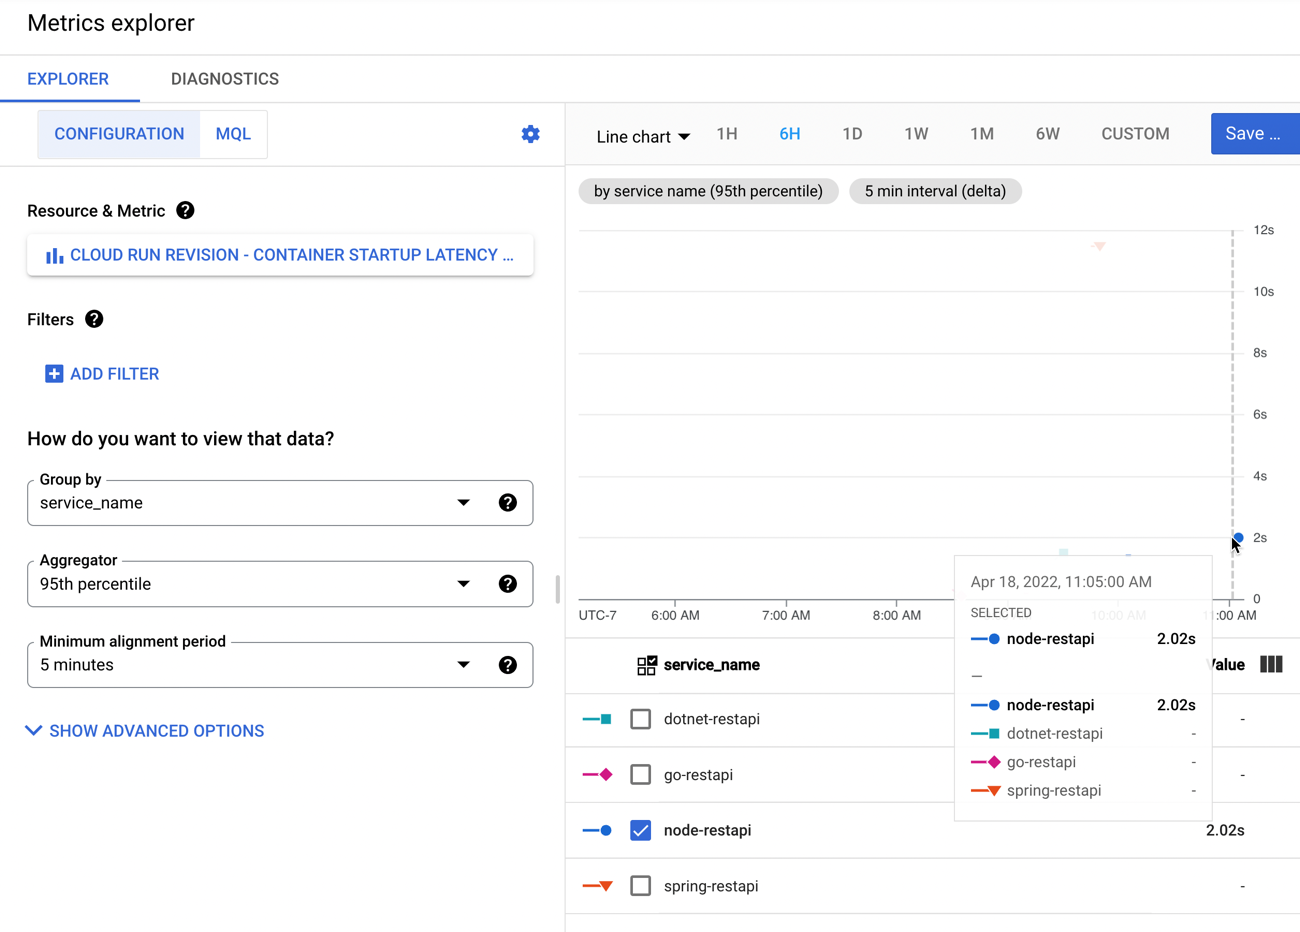
How about that new startup latency metric? I jumped into Cloud Monitoring directly to see that. There are lots of ways to aggregate this data (mean, standard deviation, percentile) and I chose the 95th percentile. My container startup time is pretty darn fast (at 95th percentile, it’s 106.87 ms), and then stays up to handle the load, so I don’t incur a startup cost for the chain of requests.
Finally, with some warm instances running, I ran the load test again. You can see how speedy things are, with virtually no “slow” responses. Go is an excellent choice for your FaaS or container-based workloads if speed matters.
Summary:
  Total:        2.1548 secs
  Slowest:      0.5008 secs
  Fastest:      0.0631 secs
  Average:      0.0900 secs
  Requests/sec: 92.8148

  Total data:   30800 bytes
  Size/request: 154 bytes

Response time histogram:
  0.063 [1]     |
  0.107 [185]   |■■■■■■■■■■■■■■■■■■■■■■■■■■■■■■■■■■■■■■■■
  0.151 [2]     |
  0.194 [10]    |■■
  0.238 [0]     |
  0.282 [0]     |
  0.326 [0]     |
  0.369 [0]     |
  0.413 [0]     |
  0.457 [1]     |
  0.501 [1]     |


Latency distribution:
  10% in 0.0717 secs
  25% in 0.0758 secs
  50% in 0.0814 secs
  75% in 0.0889 secs
  90% in 0.1024 secs
  95% in 0.1593 secs
  99% in 0.4374 secs
C# (.NET)
Ah, .NET. I started using it with the early preview release in 2000, and considered myself a (poor) .NET dev for most of my career. Now, I dabble. .NET 6 looks good, so I built my REST API with that.
Update: I got some good feedback from folks that I could have tried this .NET app using the new minimal API structure. I wasn’t sure it’d make a difference, but tried it anyway. Resulted in the same container size, and roughly the same response time (4.2088 seconds for all 200 requests) and startup latency (2.23s at 95th percentile). Close, but actually a tad slower! On the second pass of 200 requests, the total response time was almost equally (1.6915 seconds) fast as the way I originally wrote it.
My Employee object definition is straightforward.
namespace dotnet_restapi;

public class Employee {

    public Employee(string id, string fullname, string location, string jobtitle) {
        this.Id = id;
        this.FullName = fullname;
        this.Location = location;
        this.JobTitle = jobtitle;
    }

    public string Id {get; set;}
    public string FullName {get; set;}
    public string Location {get; set;}
    public string JobTitle {get; set;}
}
The Controller has a single operation and returns a List of employee objects.
using Microsoft.AspNetCore.Mvc;

namespace dotnet_restapi.Controllers;

[ApiController]
[Route("[controller]")]
public class EmployeesController : ControllerBase
{

    private readonly ILogger<EmployeesController> _logger;

    public EmployeesController(ILogger<EmployeesController> logger)
    {
        _logger = logger;
    }

    [HttpGet(Name = "GetEmployees")]
    public IEnumerable<Employee> Get()
    {
        List<Employee> emps = new List<Employee>();
        emps.Add(new Employee("100", "Bob Belcher", "SAN", "Head Chef"));
        emps.Add(new Employee("101", "Philip Frond", "SAN", "Counselor"));

        return emps;
    }
}
The program itself simply looks for an environment variable related to the HTTP port, and starts up the server. Much like above, to build this app and produce a container image, it only takes this one command:
The results were solid. You can see a total execution time of about 3.6 seconds, with a few instances taking 2 seconds, and the rest coming back super fast.
I checked the Cloud Run metrics, and see that request latency was high on a few requests, but the majority were fast. Memory was around 30% utilization. Very little CPU consumption.
For container startup latency, the number was 1.492s at the 95th percentile. Still not bad.
Oh, and sending in another 200 requests with my .NET containers warmed up resulted in some smokin’ fast responses.
Now let’s try it with a Spring Boot application. I learned Spring when I joined Pivotal, and taught a couple Pluralsight courses on the topic. Spring Boot is a powerful framework, and you can build some terrific apps with it. For my REST API, I began at start.spring.io to generate my reactive web app.
The “employee” definition should look familiar at this point.
package com.seroter.springrestapi;

public class Employee {

    private String Id;
    private String FullName;
    private String Location;
    private String JobTitle;

    public Employee(String id, String fullName, String location, String jobTitle) {
        Id = id;
        FullName = fullName;
        Location = location;
        JobTitle = jobTitle;
    }
    public String getId() {
        return Id;
    }
    public String getJobTitle() {
        return JobTitle;
    }
    public void setJobTitle(String jobTitle) {
        this.JobTitle = jobTitle;
    }
    public String getLocation() {
        return Location;
    }
    public void setLocation(String location) {
        this.Location = location;
    }
    public String getFullName() {
        return FullName;
    }
    public void setFullName(String fullName) {
        this.FullName = fullName;
    }
    public void setId(String id) {
        this.Id = id;
    }
}
Then, my Controller + main class exposes a single REST endpoint and returns a Flux of employees.
I could have done some more advanced configuration to create a slimmer JAR file, but I wanted to try this with the default experience. Once again, I used a single Cloud Build command to generate a container from this app. I do appreciate how convenient this is!
Not surpassingly, a Java container image is a bit hefty. This one clocks in at 249.7 MB in size. The container image size doesn’t matter a TON to Cloud Run, as we do image streaming from Artifact Registry which means only files loaded by your app need to be pulled. But, size still does matter a bit here.
When deploying this image to Cloud Run, I did keep the default 512 MiB of memory in place as a Java app can tend to consume more resources. The service still deployed in less than 10 seconds, which is awesome. Let’s flood it with traffic.
200 requests to my Spring Boot endpoint did ok. Clearly there’s a big startup time on the first one(s), and as a developer, that’d be where I dedicate extra time to optimizing.
The initial Cloud Run metrics show fast request latency (routing to the service), 10 containers to handle the load, and a somewhat-high CPU and memory load.
Back in Cloud Monitoring, I saw that the 95th percentile for container startup latency was 11.48s.
If you’re doing Spring Boot with serverless runtimes, you’re going to want to pay special attention to the app startup latency, as that’s where you’ll get the most bang for the buck. And consider doing a “minimum” of at least 1 always-running instance. See that when I sent in another 200 requests with warm containers running, things look good.
Finally, let’s look at JavaScript. This is what I first learned to really program in back in 1998-ish and then in my first job out of college. It continues to be everywhere, and widely supported in public clouds. For this Node.js REST API, I chose to use the Express framework. I built a simple router that returns a couple of “employee” records as JSON.
My app.js file calls out the routes and hooks it up to the /employees endpoint.
var express = require('express');
var path = require('path');
var cookieParser = require('cookie-parser');
var logger = require('morgan');

var indexRouter = require('./routes/index');
var employeesRouter = require('./routes/employees');

var app = express();

app.use(logger('dev'));
app.use(express.json());
app.use(express.urlencoded({ extended: false }));
app.use(cookieParser());
app.use(express.static(path.join(__dirname, 'public')));

app.use('/', indexRouter);
app.use('/employees', employeesRouter);

module.exports = app;
At this point, you know what it looks like to build a container image. But, don’t take it for granted. Enjoy how easy it is to do this even if you know nothing about Docker.
Our resulting image is a trim 82 MB in size. Nice!
For my Node.js app, I chose the default options for Cloud Run, but shrunk the memory demands to only 256 MiB. Should be plenty. The service deployed in a few seconds. Let’s flood it with requests!
How did our cold Node.js app do? Well! All requests were processed in about 6 seconds, and the vast majority returned a response in around 0.3 seconds.
Summary:
  Total:        6.0293 secs
  Slowest:      2.8199 secs
  Fastest:      0.0650 secs
  Average:      0.2309 secs
  Requests/sec: 33.1711

  Total data:   30200 bytes
  Size/request: 151 bytes

Response time histogram:
  0.065 [1]     |
  0.340 [186]   |■■■■■■■■■■■■■■■■■■■■■■■■■■■■■■■■■■■■■■■■
  0.616 [0]     |
  0.891 [0]     |
  1.167 [0]     |
  1.442 [1]     |
  1.718 [1]     |
  1.993 [1]     |
  2.269 [0]     |
  2.544 [4]     |■
  2.820 [6]     |■


Latency distribution:
  10% in 0.0737 secs
  25% in 0.0765 secs
  50% in 0.0805 secs
  75% in 0.0855 secs
  90% in 0.0974 secs
  95% in 2.4700 secs
  99% in 2.8070 secs
A peek at the default Cloud Run metrics show that we ended up with 10 containers handling traffic, some CPU and memory spikes, a low request latency.
The specific metrics around container startup latency shows a very quick initial startup time of 2.02s.
A final load against our Node.js app shows some screaming performance against the warm containers.
Summary:
  Total:        1.8458 secs
  Slowest:      0.1794 secs
  Fastest:      0.0669 secs
  Average:      0.0901 secs
  Requests/sec: 108.3553

  Total data:   30200 bytes
  Size/request: 151 bytes

Response time histogram:
  0.067 [1]     |
  0.078 [29]    |■■■■■■■■■■
  0.089 [114]   |■■■■■■■■■■■■■■■■■■■■■■■■■■■■■■■■■■■■■■■■
  0.101 [34]    |■■■■■■■■■■■■
  0.112 [6]     |■■
  0.123 [6]     |■■
  0.134 [0]     |
  0.146 [0]     |
  0.157 [0]     |
  0.168 [7]     |■■
  0.179 [3]     |■


Latency distribution:
  10% in 0.0761 secs
  25% in 0.0807 secs
  50% in 0.0860 secs
  75% in 0.0906 secs
  90% in 0.1024 secs
  95% in 0.1608 secs
  99% in 0.1765 secs
Wrap up
I’m not a performance engineer by any stretch, but doing this sort of testing with out-of-the-box settings seemed educational. My final container startup latency numbers at the 95th percentile were:
There are many ways to change these numbers. If you have a more complex app with more dependencies, it’ll likely be a bigger container image and possibly a slower startup. If you tune the app to do lazy loading or ruthlessly strip out unnecessary activation steps, your startup latency goes down. It still feels safe to say that if performance is a top concern, look at Go. C# and JavaScript apps are going to be terrific here as well. Be more cautious with Java if you’re truly scaling to zero, as you may not love the startup times.
The point of this exercise was to explore how apps written in each language get packaged and started up in a serverless compute environment. Something I missed or got wrong? Let me know in the comments!
A simple use case came to mind yesterday. How would I quickly find out if someone put a too-big file into a repository? In ancient times (let’s say, 2008), here’s what I would have done to solve that. First I’d have to find a file share or FTP location to work with. Then I’d write some custom code with a file system listener that reacted to new documents hitting that file location. After that, I’d look at the size and somehow trigger an alert if the file exceeded some pre-defined threshold. Of course, I’d have to find a server to host this little app on, and figure out how to deploy it. So, solving this might take a month or more. Today? Serverless, baby! I can address this use case in minutes.
I’m learning to program in Go, so ideally, I want a lightweight serverless function written in Go that reacts whenever a new file hits an object store. Is that easy to do in each major public cloud entirely with the console UIs? I just went on a journey to find out, without preparing ahead of time, and am sharing my findings in real time.
Disclaimer: I work at Google Cloud but I am a fairly regular user of other clouds, and was a 12-time Microsoft MVP, mostly focused on Azure. Any mistakes below can be attributed to my well-documented ignorance, and not about me trying to create FUD!
Google Cloud
First up, the folks paying my salary. How easily could I add a Cloud Function that responds to things getting uploaded to Cloud Storage?
First, I created a new bucket. This takes a few seconds to do.
Hey, what’s this? From the bucket browser, I can actually choose to “process with Cloud Functions.” Let’s see what this does.
Whoa. I get an inline “create function” experience with my bucket-name pre-populated, and the ability to actually author the function code RIGHT HERE.
The Go code template was already populated with a “storage” object as input, and I extended it to include the “size” attribute. Then I added a quick type conversion, and check to see if the detected file was over 1MB.
// Package p contains a Google Cloud Storage Cloud Function.
package p

import (
	"context"
	"log"
	"strconv"
)

// GCSEvent is the payload of a GCS event. Please refer to the docs for
// additional information regarding GCS events.
type GCSEvent struct {
	Bucket string `json:"bucket"`
	Name   string `json:"name"`
	Size   string `json:"size"`
}

// HelloGCS prints a message when a file is changed in a Cloud Storage bucket.
func HelloGCS(ctx context.Context, e GCSEvent) error {
	log.Printf("Processing file: %s", e.Name)

	intSize, _ := strconv.Atoi(e.Size)

	if intSize > 1000000 {
		log.Printf("Big file detected, do something!")
	} else {
		log.Printf("Normal size file detected")
	}

	return nil
}
After deploying it, I want to test it. To do so, I just dropped two files—one that was 54 bytes and another that was over 1MB.
Now I’m heading over to the Cloud Functions dashboard and looking at the inline “Logs” tab. This shows me the system logs, as well as anything my function itself emitted. After just a moment, I see the logs my function wrote out, including the “normal size file” and “big file detected” messages.
Goodness that was easy. The same sort of in-experience trigger exists for Pub/Sub, making it easy to generate functions that respond to messaging events.
The other UI-driven way to do this. From the Cloud Functions experience, I chose to add a new function. You see here that I have a choice of “trigger.”
I chose “Cloud Storage” and then picked from a list of possible event types. Let’s also choose the right bucket to listen in on. Note that from this creation wizard, I can also do things like set the memory allocation and timeout period, define the minimum and maximum instance count, add environment variables, reference secrets, and define ingress and egress permissions.
Next, I have to add some source code. I can upload a zip file, reference a zip file in Cloud Storage, point to a source code repository, or add code inline. Let’s do that. What I love is that the code template recognizes my trigger type, and takes in the object representing the storage event. For each language. That’s a big time-saver, and helps new folks understand what the input object should look like. See here:
Here, I picked Go again, used the same code as before, and deployed my function. Once again, it cleanly processes any event related to new files getting added to Cloud Storage. Cloud Functions is underrated, and super easy to work with.
End to end, this solution should take 2-5 minutes tops to complete and deploy. That’s awesome. Past Richard would be crying for joy right now.
AWS
The grandaddy of serverless should be pretty good at this scenario too! From humble beginnings, AWS Lambda has seemingly becomes the preferred app platform in that ecosystem. Let’s use the AWS console experience to build a Lambda function that responds to new files landing in an S3 bucket.
First, I need an S3 bucket. Easy enough, and accepting all the default settings.
My bucket is now there, and I’m looking around, but don’t see any option to create a Lambda function from within this S3 interface. Maybe I’m missing it, but doesn’t seem so.
No problem. Off to the Lambda dashboard. I click the very obvious “create function” button and am presented with a screen that asks for my function name and runtime, and the source of code.
Let’s see what “from scratch” means, as I’d probably want some help via a template if it’s too bare bones. I click “create function” to move forward.
Ok, rats, I don’t get an inline code editor if I want to write code in Go. Would have been useful to know beforehand. I’ll delete this function and start over, this time, looking for a blueprint that might provide a Go template for reading from S3.
Doesn’t look like there’s anything for Go. If I want a blueprint, I’m choosing between Python and Node. Ok, I’ll drop by Go requirement, and crank out this Lambda function in JavaScript. I picked that s3-get-object template, and then provide a function name and a role that can access S3. I’m asked for details about my S3 trigger (bucket name, event type) and shown the (uneditable) blueprint code. I’d like to make changes, but I guess I wait until later, so I create the function.
Shoot, I did something wrong. Got an error that, on the plus side, is completely opaque and unreadable.
Not be stopped, I’ll try clicking “add trigger” here, which lets me choose among a variety of sources, including S3, and this configuration seems to work fine.
I want to update the source code of my function, so that it logs alerts for big files. I updated the Lambda code (after looking up the structure of the inbound event object) and clicked “deploy” to apply this new code.
Not too bad. Ok, let’s test this. In S3, I just dropped a handful of files into the bucket. Back in the Lambda console, I jump to the “Monitor” tab to see what’s up.
I’ve got the invocations listed here. I can’t see the logs directly, but looks like I need to click the LogStream links to view the invocation logs. Doing that takes me to a new window where I’m now in CloudWatch. I now see the logs for this particular set of invocations.
Solid experience. A few hiccups, but we’ll chalk some of that up to my incompetence, and the remainder to the fact that AWS UIs aren’t always the most intuitive.
Microsoft Azure
Azure, my old friend. Let’s see how I can use the Azure Portal to trigger an Azure Function whenever I add something to a storage bucket. Here we go.
Like with the walkthroughs above, I also need to setup some storage. From the home page, I click “create resource” and navigate on the left-hand side to “Storage.” And … don’t see Azure Storage. *Expletive*.
I can’t find what category it’s in, but just noticed it in the “Get started” section. It’s weird, but whatever. I pick an Azure subscription and resource group, try to set a name (and remember that it doesn’t accept anything but letters and numbers, no dashes), and proceed. It validates something (not sure I’ve ever seen this NOT pass) and then I can click “create.”
After thirty seconds, I have my storage account. Azure loves “things contained within things” so this storage account itself doesn’t hold objects. I create a “container” to hold my actual documents.
Like with Lambda, I don’t see a way from this service to create an event-driven function. [Updated 2-13-22: A reader pointed out that there is an “events” experience in Storage that lets you somewhat create a function (but not the Function App itself). While convenient, the wizard doesn’t recognize where you are, and asks what sort of Function (storage!) you want to build. But it’s definitely something.]
So, let’s go to the Azure Functions experience. I’m asked to create a “Function App.” There’s no option to choose Go as a managed language, so I’ll once again pick Node. YOU WIN AGAIN JAVASCRIPT.
I move on to the next pane of the wizard where I’m asked about hosting stack. Since this is 2022, I chose Linux, even though Windows is somehow the recommended stack for Node functions. After a few moments, I have my Function app.
As with the storage scenario, this Function app isn’t actually the function. I need to add a function to the app. Ok, no problem. Wait, apparently you can’t use the inline editor for Linux-based functions because of reasons.
Sigh. I’ll create a new Function App, this time choosing Windows as the host. Now when I choose to add a function to this Function App, I see the option for “develop in portal”, and can choose a trigger. That’s good. I’ll choose the Storage Blob trigger, but I’m not clear on the parameter values I’m supposed to provide. Hmm, the “learn more” goes to a broken page. Found it by Googling directly. Looks like the “path” is the name of the container in the account, and {name} is a standard token.
The creation succeeded, and now I have a function. Sweet. Let’s throw some code in here. The “Code + Test” window looks like an inline editor. I updated the code to do a quick check of file size, and hope it works.
After saving it (I don’t see a concept of versioning), I can test it out. Like I did for Google Cloud and AWS, I dragged a couple of files onto the browser window pointing at the Storage Blob. Looks like the Azure Portal doesn’t support drag-and-drop. I’ll use the “upload files” wizard like an animal. After uploading, I switch back to the Azure Functions view which offers a “Monitor” view.
I don’t love that “results may be delayed for up to 5 minutes” as I’m really into instant gratification. The Function dashboard shows two executions right away, but the logs are still delayed for minutes after that. Eventually I see the invocations show up, and it shows execution history (not app logs).
I can’t seem to find the application logs, as the “logs” tab here seems to show a stream, but nothing appears here for me. Application Insights doesn’t seem to show the logs either. They could be lost to the universe, or more likely, I’m too bad at this to find them.
Regardless, it works! My Azure Function runs when objects land in my Storage account.
Wrap Up
As to the options considered here, it seemed obvious to me that Google Cloud has the best dev experience. The process of creating a function is simple (and even embedded in related services), the inline editor easily works for all languages, and the integrated log monitoring made my build-deploy-test loop faster. The AWS experience was fine overall, although inconsistent depending on your programming language. And the Azure experience, honestly, felt super clunky and the Windows-centricity feels dated. I’m sure they’ll catch up soon.
Overall, this was pretty fun. Managed services and serverless computing makes these quick solutions so simple to address. It’s such an improvement for how we had to do this before!
You’re familiar with twelve-factor apps? This relates to a set of principles shared by Heroku over a decade ago. The thinking goes, if your app adheres to these principles, it’s more likely to be scalable, resilient, and portable. While twelve-factor apps were introduced before Docker, serverless, or mainstream cloud adoption were a thing, I think these principles remain relevant in 2022. One of those principles relates to externalizing your configuration so that environment-related settings aren’t in code. Spring Cloud Config is a fun project that externalizes configurations for your (Java) app. It operates as a web server that serves up configurations sourced from a variety of places including git repos, databases, Vault, and more. A month ago, I saw a single-line mention in the Spring Cloud release notes that said Spring Cloud Config now integrates with Google Cloud Secret Manager. No documentation or explanation of how to use this feature? CHALLENGE ACCEPTED.
To be sure, a Spring Boot developer can easily talk to Google Cloud Secret Manager directly. We already have a nice integration here. Why add the Config Server as an intermediary? One key reason is to keep apps from caring where the configs come from. A (Spring Boot) app just needs to make an HTTP request or use the Config Client to pulls configs, even if they came from GitHub, a PostgreSQL database, Redis instance, or Google Cloud Secret Manager. Or any combination of those. Let’s see what you think once we’re through.
Setting up our config sources
Let’s pull configs from two different places. Maybe the general purpose configuration settings are stored in git, and the most sensitive values are stored in Secret Manager.
My GitHub repo has a flat set of configuration files. The Spring Cloud Config Server reads all sorts of text formats. In this case, I used YAML. My “app1” has different configs for the “dev” and “qa” environments, as determined by their file names.
Secret Manager configs work a bit differently than git-based ones. The Spring Cloud Config Server uses the file name in a git repo to determine the app name and profile (e.g. “app1-qa.yml”) and makes each key/value pair in that file available to Spring for binding to variables. So from the image above, those three properties are available to any instance of “app1” where the Spring profile is set to “qa.” Secret Manager itself is really a key/value store. So the secret name+value is what is available to Spring. The “app” and “profile” come from the labels attached to the secret. Since you can’t have two secrets with the same name, if you want one secret for “dev” and one for “qa”, you need to name them differently. So, using the Cloud Code extension for VS Code, I created three secrets.
Two of the secrets (connstring-dev, connstring-qa) hold connection strings for their respective environments, and the other secret (serviceaccountcert) only applies to QA, and has the corresponding label values.
Ok, so we have all our source configs. Now to create the server that swallows these up and flattens the results for clients.
Creating and testing our Spring Cloud Config Server
Creating a Spring Cloud Config Server is very easy. I started at the Spring Intializr site to bootstrap my application. In fact, you can click this link and get the same package I did. My dependencies are on the Actuator and Config Server.
The Google Cloud Secret Manager integration was added to the core Config Server project, so there’s config-specific dependency to add. It does appear you need to add a reference to the Secret Manager package to enable connectivity and such. I added this to my POM file.
There’s no new code required to get a Spring Cloud Config Server up and running. Seriously. You just add an annotation (@EnableConfigServer) to the primary class.
@EnableConfigServer
@SpringBootApplication
public class BootConfigServerGcpApplication {

	public static void main(String[] args) {
		SpringApplication.run(BootConfigServerGcpApplication.class, args);
	}
}
The final step is to add some settings. I created an application.yaml file that looks like this:
Let’s unpack this. First I set the port to whatever the environment provides, or 8080. I’m setting two active profiles here, so that I activate the Secret Manager and git environments. For the “gcp-secret-manager” block, you see I have the option to set the label values to designate the application and profile. If I wanted to have my secret with a label “appname:app1” then I’d set the application-label property here to “appname.” Make sense? I fumbled around with this for a while until I understood it. And notice that I’m pointing at the GitHub repo as well.
One big thing to be aware of on this Secret Manager integration with Config Server. Google Cloud has the concept of “projects.” It’s a key part of an account hierarchy. You need to provide the project ID when interacting with the Google Cloud API. Instead of accepting this as a setting, the creators of the Secret Manager integration look up the value using a metadata service that only works when the app is running in Google Cloud. It’s a curious design choice, and maybe I’ll submit an issue or pull request to make that optional. In the meantime, it means you can’t test locally; you need to deploy the app to Google Cloud.
Fortunately, Google Cloud Run, Secret Manager, and Artifact Registry (for container storage) are all part of our free tier. If you’re logged into the gcloud CLI, all you have to do is type gcloud run deploy and we take your source code, containerize it using buildpacks, add it to Artifact Registry, and deploy a Cloud Run instance. Pretty awesome.
After a few moments, I have a serverless container running Spring middleware. I can scale to zero, scale to 1, handle concurrent requests, and maybe pay zero dollars for it all.
Let’s test this out. We can query a Config Server via HTTP and see what a Spring Boot client app would get back. The URL contains the address of the server and path entries for the app name and profile. Here’s the query for app1 and the dev profile.
See that our config server found two property sources that matched a dev profile and app1. This gives a total of three properties for our app to use.
Let’s swap “dev” for “qa” in the path and get the configurations for the QA environment.
The config server used different sources, and returns a total of five properties that our app can use. Nice!
Creating and testing our config client
Consuming these configurations from a Spring Boot app is simple as well. I returned to the Spring Initializr site and created a new web application that depends on the Actuator, Web, and Config Client packages. You can download this starter project here.
My demo-quality code is basic. I annotated the main class as a @RestController, exposed a single endpoint at the root, and returned a couple of configuration values. Since the “dev” and “qa” connection strings have different configuration names—remember, I can’t have two Secrets with the same name—I do some clunky work to choose the right one.
@RestController
@SpringBootApplication
public class BootConfigClientGcpApplication {

	public static void main(String[] args) {
		SpringApplication.run(BootConfigClientGcpApplication.class, args);
	}

	@Value("${appversion}")
	String appVersion;

	@Value("${connstring-dev:#{null}}")
	String devConnString;

	@Value("${connstring-qa:#{null}}")
	String qaConnString;

	@GetMapping("/")
	public String getData() {
		String secret;
		secret = (devConnString != null) ? devConnString : qaConnString;
		return String.format("version is %s and secret is %s",appVersion, secret);
	}
}
The application.yaml file for this application has a few key properties. First, I set the spring.application.name, which tells the Config Client which configuration properties to retrieve. It’ll query for those assigned to “app1”. Also note that I set the profile to “dev”, which also impacts the query. And, I’m exposing the “env” endpoint of the actuator, which lets me peek at all the environment variables available to my application.
Ok, let’s run this. I can do it locally, since there’s nothing that requires this app to be running in any particular location.
Cool, so it returned the values associated with the “dev” profile. If I stop the app, switch the spring.profiles.active to “qa” and restart, I get different property values.
So the Config Client in my application is retrieving configuration properties from the Config Server, and my app gets whatever values make sense for a given environment with zero code changes. Nice!
If we want, we can also check out ALL the environment variables visible to the client app. Just send a request to the /actuator/env endpoint and observe.
Summary
I like Spring Cloud Config. It’s a useful project that helps devs incorporate the good practice of externalizing configuration. If you want a bigger deep-dive into the project, check out my new Pluralsight course that covers it.
Also, take a look at Google Cloud Run as a legit host for your Spring middleware and apps. Instead of over-provisioning VMs, container clusters, or specialized Spring runtimes, use a cloud service that scales automatically, offers concurrency, supports private traffic, and is pay-for-what-you-use.