I have a love/hate relationship with workflow technologies after 20+ years of working with them. On the plus side, these technologies often provide a good way to quickly model a process without having to code a bunch of boilerplate stuff. And a good workflow runtime handles the complex stuff like starting up a workflow instance, saving state when the workflow is long-running, and enabling things like retries for failed instances. The downside of workflow tech? You’re often wrangling clumsy design interfaces, stitching together multiple components to achieve something you could have solved with a single line of code, and stuck using unique domain-specific languages (DSLs) with zero (or limited) portability. I get why some folks build workflow solutions out of databases and background workers! But maybe there’s something better.
Last year, Google Cloud (where I work) shipped Cloud Workflows. It’s a fully managed design and runtime service where you only pay when a workflow is running. Basically, you’d use Cloud Workflows to run event-based or scheduled processes that coordinate web endpoints (serverless functions, REST APIs) or managed services (databases, AI/ML services). It’s similar to AWS Step Functions, and somewhat like Azure Logic Apps. We just added support for parallel processing, and it’s a very smart implementation. Let’s take a look at examples that you can try out for free.

First, here are five things that I like about Cloud Workflows:
- Declarative format. Write Workflows in YAML or JSON and get a visual representation. I like this model versus fighting a graphical UI that buries settings or overwhelms the user with millions of options.
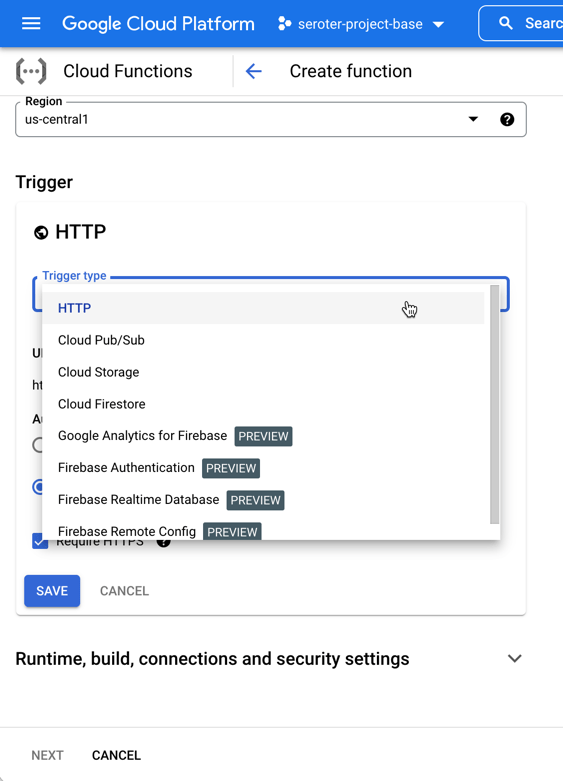
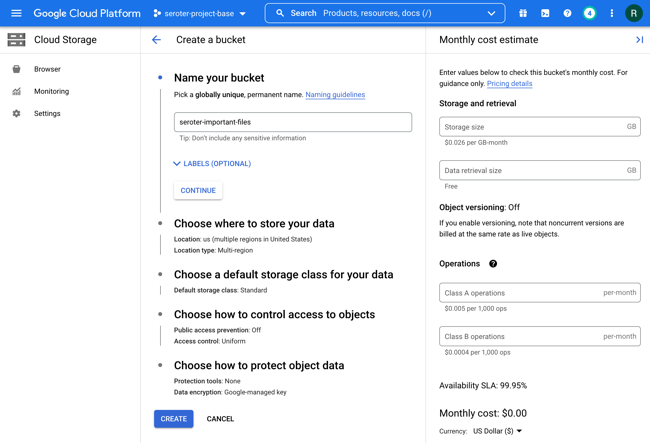
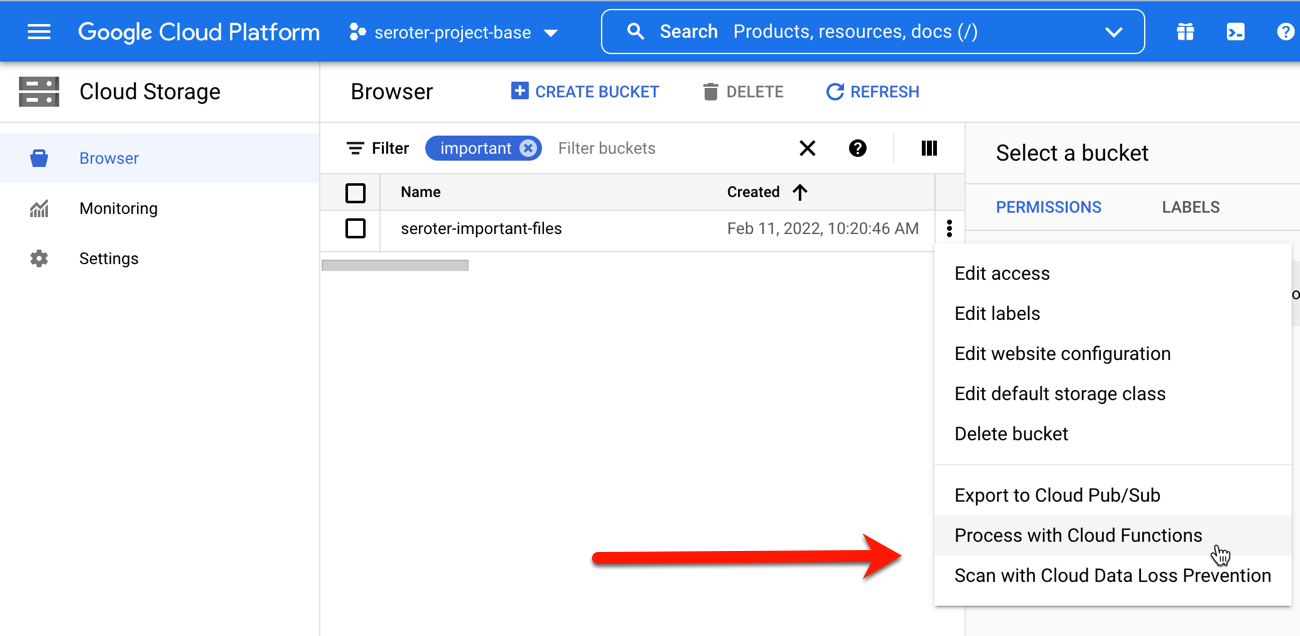
- Event-driven triggers. Cloud Workflows integrates with Eventarc, the eventing subsystem that sends messages based on things happening within Google Cloud (e.g. object loaded into storage bucket, database backup completed).
- Built-in connectors. A connector makes it easier to talk to Google Cloud services from a Workflow. Set a few properties on a connector without learning the full service API.
- Production-ready serverless. Cloud Workflows is compliant with a number of certifications and standards. Like Step Functions, Cloud Workflows is a purely managed service that’s pay-as-you-go and scales automatically. Azure Logic Apps offers this approach as well (“consumption plan”), but only recommends it for dev/test. Rather, they encourage single tenancy for their service.
- A mix of sophisticated and basic operations. Cloud Workflows does some powerful things like automatic type conversion, callbacks for long-running processes, handling errors and retries, and even invoking private endpoints. But it also does things that SHOULD be easy (but aren’t always easy in other workflow engines), like defining and using variables and writing out logs. You can do a lot before you HAVE to jump into code.
One of those sophisticated operations in a workflow is parallel processing. That is, executing more than one blocking call at the same time. This is a sneaky-hard problem to solve in a workflow engine, especially when it comes to shared data. Can both parallel branches see and access the same data? How to avoid collisions? With AWS Step Functions, they’ve gotten around this problem by passing data by value (not reference) into a branch and not allowing state transfers between branches. Cloud Workflows takes a different approach to data in parallel branches. With our implementation, you define “shared variables” that are available to any and all branches that run concurrently. We handle the atomic updates for you and data changes are immediately available to other branches. Pretty cool!
Example #1 – Basic Cloud Workflow
How about we start out with something straightforward. Here, I declared a few variables up front, added a log message, then a switch statement which called one of two steps before sending a result.
#basic starter workflow
- step1:
   #define and assign variables for use in the workflow
   assign:
    - var1: 100           #can be numbers
    - var2: "Richard"     #can be text
    - var3: "SAN"
    - var4:               #can be instantiated as null
    - var5: ~             #this is null as well
    - varlist: ["item1"]  #how about a list too?
- step2:
   call: sys.log          #call to standard library to write a log message
   args:
     data: ${var2}
- step3:
   switch:                #control flow example
     - condition: ${var3 == "SAN"}
       next: dostuff1
     - condition: true
       next: dostuff2
   next: final
- dostuff1:
   assign:
     - var4: "full-time employee"
     - varlist: ${list.concat(varlist, "item2")}  #add item to list
   next: final
- dostuff2:
   assign:
     - var4: "part-time employee"
     - varlist: ${list.concat(varlist, "item3")}  #add item to list
   next: final
- final:
   return: ${varlist}     #the result of the workflow itself
Here’s the generated visual representation of this workflow.

After deploying the workflow, I chose the in-console option to execute the workflow. You can see that I have the option to provide input values. And I chose to log all the calls, which makes it easier to trace what’s going on.

When I execute the workflow, I get a live update to the logs, and the output itself. It’s a helpful interface.

Example #2 – Workflow with parallel processing and read-only variables
How about we try a workflow with concurrent branches? It uses the “parallel” control flow action, and I defined a pair of branches that each log a message. Notice that each one can access the “var1” variable. Read-only access to a global variable doesn’t require anything special.
# basic parallel steps that work, can read variables without marking as shared
- step1:
   assign:
    - var1: 100
    - var2: 200
- step2:
   call: sys.log
   args:
     data: ${var1}
- step3:
   parallel:              #indicate parallel processing ahead
     branches:
       - branch1:         #first branch which can access var1 declared above
           steps:
             - dostuff:
                call: sys.log
                args:
                  text: ${"log message " + string(var1)}
       - branch2:         #second branch which access the same variable
           steps:
             - dostuff2:
                call: sys.log
                args:
                  data: ${var1}
- final:
   return: ${var1}
The visual representation of parallel branches looks like this.

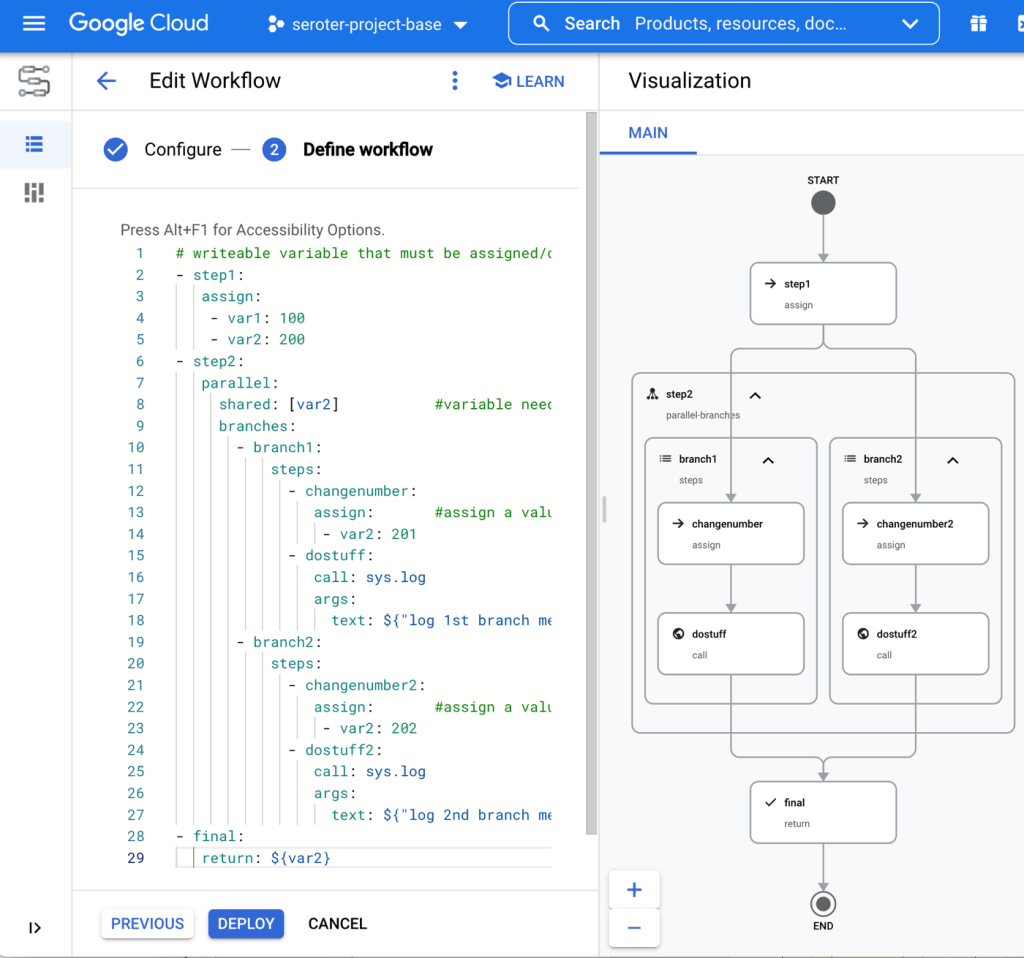
Example #3 – Workflow with shared, writable variable
The above workflow throws an error if I try to assign a value to that global variable from within a branch. What if I want one or more branches to update a shared variable? It could be a counter, an array, or something else. In this scenario, each branch sets a value. These branches aren’t guaranteed to run in any particular order, so if you run this workflow a few times, you’ll see different final values for “var2.”
# writeable variable that must be assigned/declared first before indicated as "shared"
- step1:
   assign:
    - var1: 100
    - var2: 200
- step2:
   parallel:
     shared: [var2]           #variable needs to be declared earlier to be "shared" here
     branches:
       - branch1:
           steps:
             - changenumber:
                assign:       #assign a value to the shared variable
                 - var2: 201
             - dostuff:
                call: sys.log
                args:
                  text: ${"log 1st branch message " + string(var2)}
       - branch2:
           steps:
             - changenumber2:
                assign:       #assign a value to the shared variable
                 - var2: 202
             - dostuff2:
                call: sys.log
                args:
                  text: ${"log 2nd branch message " + string(var2)}
- final:
   return: ${var2}
The workflow looks like this when visualized. You can see the multiple actions per branch.

Example #4 – Workflow with shared array that’s updated within each parallel branch
An array is a type of variable in a Cloud Workflow. What if you wanted to append an item to an array from within each branch of an array? That might be tricky with some engines, but it’s straightforward here.
# writeable array
- step1:
   assign:
    - var1: 100
    - var2: 200
    - names: []         #declare array
- step2:
   parallel:
     shared: [names]    #array variable is shared with parallel branches
     branches:
       - branch1:
           steps:
             - addname:
                assign:
                 - names: ${list.concat(names, "Richard")}  #add to the array
             - dostuff:
                call: sys.log
                args:
                  text: ${"log 1st branch message "}
       - branch2:
           steps:
             - addname2:
                assign:
                 - names: ${list.concat(names, "Kris")}     #add to the array
             - dostuff2:
                call: sys.log
                args:
                  text: ${"log 2nd branch message "}
- final:
   return: ${names}
The representation is similar to the one above, but we can see when executing the workflow that the output array has a pair of names added to it.

This is a relatively simple way to append data to a shared object, even when running in a distributed, parallelized workflow.
Example #5 – Workflow with map updated with values from each parallel branch
There’s another way to do this. If you wanted to collect different data points from each branch, and then smash them into a composite object when all the branches complete, it’s not too hard. Here, I scatter and then gather.
# separate messages per branch, joined at the end
- step1:
   assign:
    - var1: ~
    - var2: ~
    - var3: {} #declare a map
- step2:
   parallel:
     shared: [var1, var2]  #still need shared variables in order to be writable in a branch
     branches:
       - branch1:
           steps:
             - getval1:
                assign:
                 - var1: "value1"
             - log1:
                call: sys.log
                args:
                  text: ${"log 1st branch message "}
       - branch2:
           steps:
             - getval2:
                assign:
                 - var2: "value2"
             - log2:
                call: sys.log
                args:
                  text: ${"log 2nd branch message "}
- gathervalues:
   assign:                 #set key/value pairs on the map object
      - var3.val1: ${var1}
      - var3.val2: ${var2}
- final:
   return: ${var3}
This could be useful in a few cases, and you can see the visual representation here.

When I call this workflow, I get back a map with a pair of key/value properties.

Example #6 – Workflow with parallel loop that updates a map variable with each iteration
You can do more than just parallel branches in a Cloud Workflow. You can also do parallelized loops. That means that multiple iterations can execute concurrently. Neat!
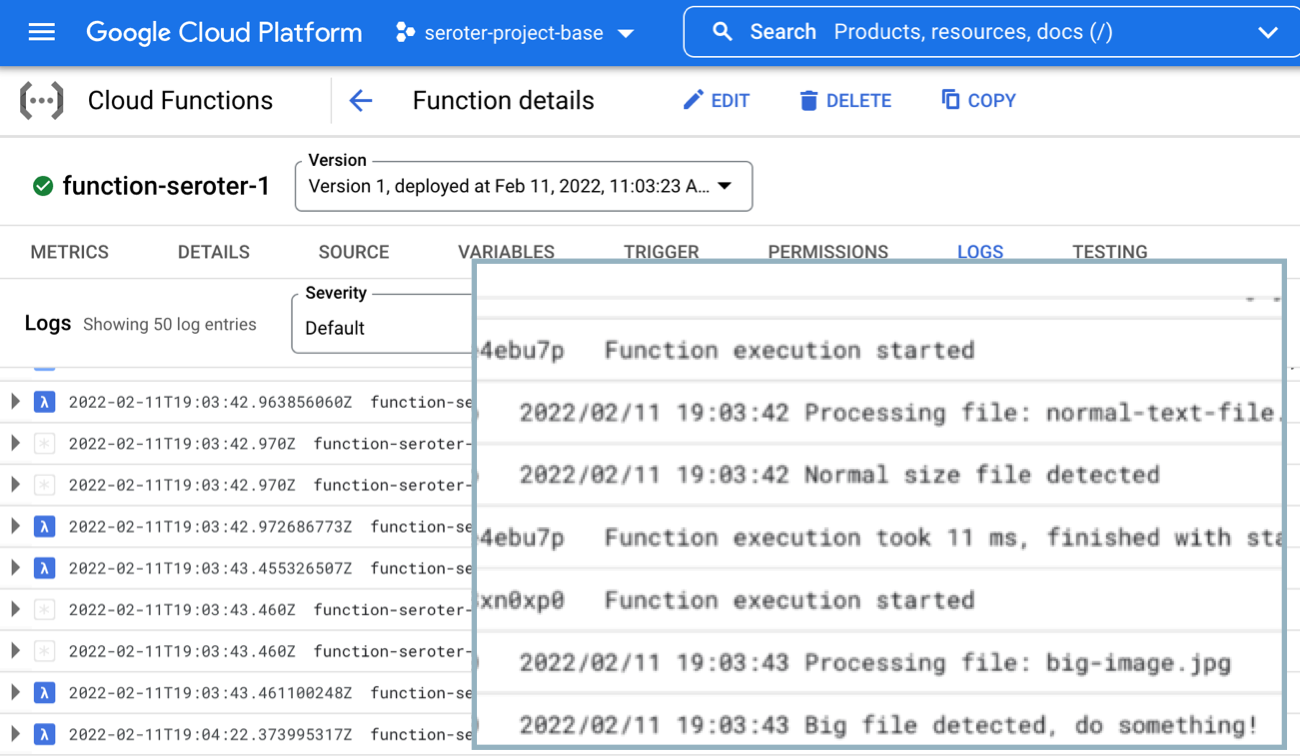
For this scenario, let’s imagine that I want to pull employee data from three different systems, and return it all as one composite object. To stub this out, I built a Cloud Function that takes in “system ID” via the querystring and returns some fixed data based on which system ID comes in. It’s contrived, but does the job.
exports.systemLookup = (req, res) => {

  var systemid = req.query.id;
  var payload;

  switch(systemid) {
    case "e1":
      payload = {name: "Richard Seroter", location: "SAN"};
      break;
    case "d1":
      payload = {department: "PM", tenure: "2.2yrs"};
      break;
    case "r1":
      payload = {latestperfrating: "3"};
      break;
    default:
      payload = {type: "employee"}
      break;
  }
  res.status(200).send(payload);
};
After I deployed this function, I built this workflow which loops through a list of employee system names and calls this Function for each one. And then takes the result and adds it to the map variable.
# parallel loop that calls a function and builds up a composite object
- step1:
   assign:
    - systemlist: ["e1", "d1", "r1"]   #list of employee systems to retrieve data from
    - employeemap: {}                  #map that holds composite result
- step2:
   parallel:
     shared: [systemlist, employeemap] #still need shared variables in order to be writable in a branch
     for:            #loop
      value: systemid
      in: ${systemlist}
      steps:
         - getEmpDetails:
            call: http.get    #call function
            args:
               url: ${"https://[host]/function-lookupfromworkflow?id=" + systemid}
            result: payload
         - logmsg:
            call: sys.log
            args:
               text: ${"log loop message " + systemid}
         - append:
            assign:           #assign the result to the map
               - employeemap[systemid]: ${payload.body}
- final:
   return: ${employeemap}
Such a workflow is visualized as such.

The result? I get a composite object back, and it happened super fast since the engine made Function calls in parallel!

Summary
Cloud Workflows are new in town, but they’re already a solid option. The DSL is powerful and yet elegantly solves tricky distributed systems problems like shared variables. I think you can run all the examples above within the confines of our free tier, which makes it simple to experiment further. Let me know what you think, and what else you’d like to see us add to Cloud Workflows.