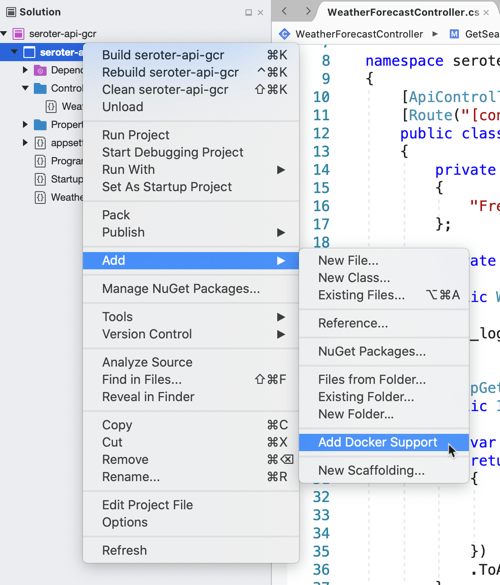
Moving isn’t fun. At least not for me. Even if you can move from one place to another, there are plenty of things that add friction. In the public cloud, you might want to switch from your first cloud to your next one, but it just feels like a lot of work. And while we cloud vendors like to talk about flashy serverless/container compute options, let’s be honest, most companies have their important workloads running in virtual machines. So how do you move those VMs from one place to another without a ton of effort? I’m going to look at four of the options, including one we just shipped at Google Cloud.
Option #1 – Move the workload, not the VM
In this case, you take what was on the original VM, and install it onto a fresh instance in the next cloud. The VM doesn’t move, the workload does. Maybe you do move the software manually, or re-point your build system to a VM instance in the new cloud.
Why do this? It’s a clean start and might give you the opportunity to do that OS upgrade (or swap) you’ve been putting off. Or you could use this time to split up the websites on a stuff server into multiple servers. This is also the one option that’s mostly guaranteed to work regardless of where you’re coming from, and where you’re going to.
The downside? It’s the most work of any of these options. You’ve got to install software, move state around, reconfigure things. Even if you do automated deployments, there’s likely new work here to bake golden images or deploy to a new cloud.
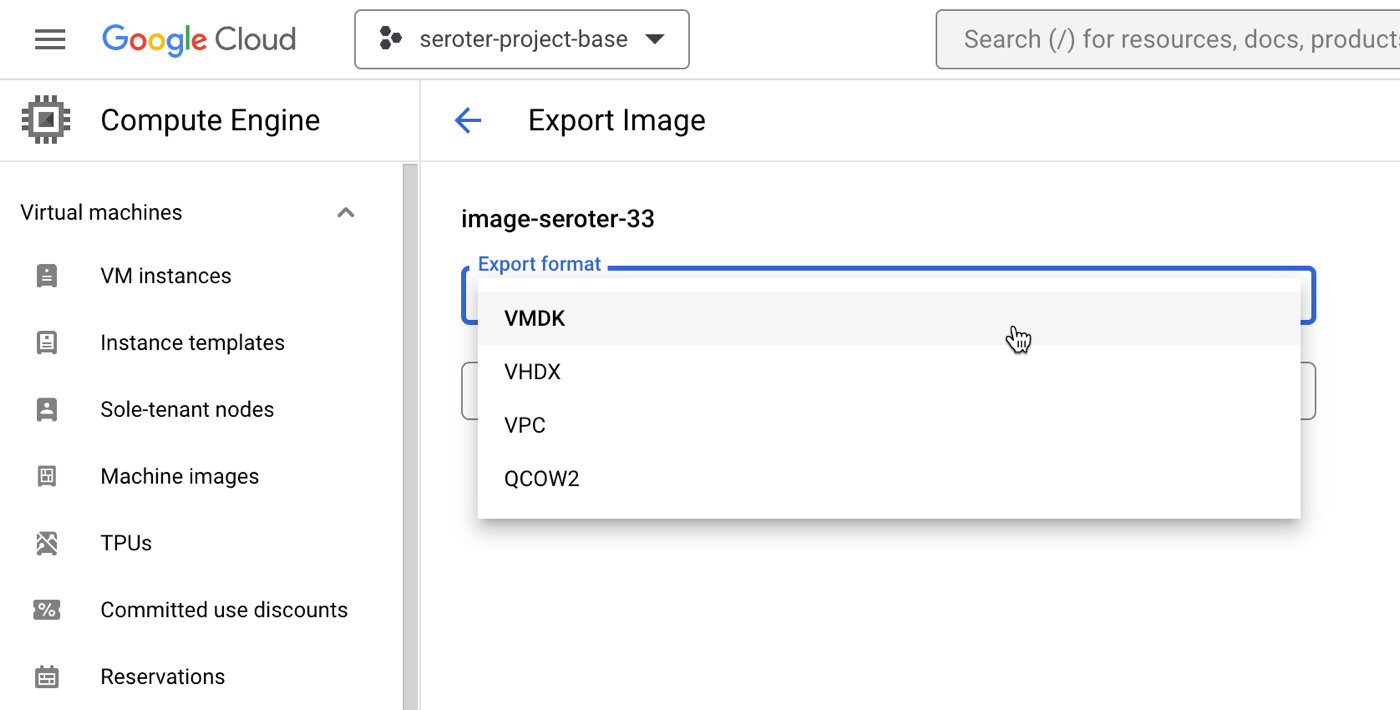
Option #2 – Export the VM images from one cloud and import into the next one
All the major clouds (and software vendors) support exporting and importing a VM image. These images come in all sorts of formats (e.g. VMDK, VHDX).
Why do this? It gives you a portable artifact that you can bring to another cloud and deploy. It’s a standard approach, and gives you a manageable asset to catalog, secure, backup, and use wherever you want. AWS offers guidance, so does Azure, as does Google Cloud. This usually carries no explicit cost, but brings with it costs for storage of the assets.
The downsides? This too is manual, although can be automated with APIs. It also moves the entire VM image without an opportunity to shrink or modernize any aspect of it. Additionally, it usually requires extra configuration of storage buckets and permissions to store the temporary artifacts.
Option #3 – Convert the VM to a container and move that artifact to the new cloud
Another way to move a VM to another cloud is to extract the VM-based application to a container image. The workload moves, but in a different format. All the major public clouds have something here. Azure Migrate helps with this, AWS provides an App2Container CLI tool, and Google Cloud offers Migrate to Containers as a CLI and UI-based experience.
So, what do you do with those existing .NET Framework apps on Windows? Most advice is "upgrade to #dotnet Core." But I hear that many folks want to freeze on .NET 4.8 for now.
Why do this? This offers a means of “shrinking” the workload by reducing it to its own components, without bringing along the OS with it. This can bring higher workload density in the target cloud (if you throw a bunch of app containers onto consolidated hardware) and reduce cost. Also, this gives you flexibility on where you run the workload next. For instance, the container image you generate from the Google Cloud tool can run on a Kubernetes cluster or serverless Cloud Run environment.
Downsides? This doesn’t work for all workload types. Don’t shove SharePoint into a container, for example. And not all tools work with all the various clouds, so you might have to move the VM manually and then run the containerization tool. Also, doing this may give the impression you’re modernizing the app, but in reality, you’re only modernizing the underlying platform. That is valuable, but doesn’t remove the need for other modernization activities.
Option #4 – Use a managed service that moves the VM and turns down the old instance
Can migration be easier? Can you move VMs around with fewer steps and moving parts? There are definitely solutions for this from a variety of vendors. Among cloud providers, what Google Cloud has is unique. We just added a new experience, and figured we could walk through it together.
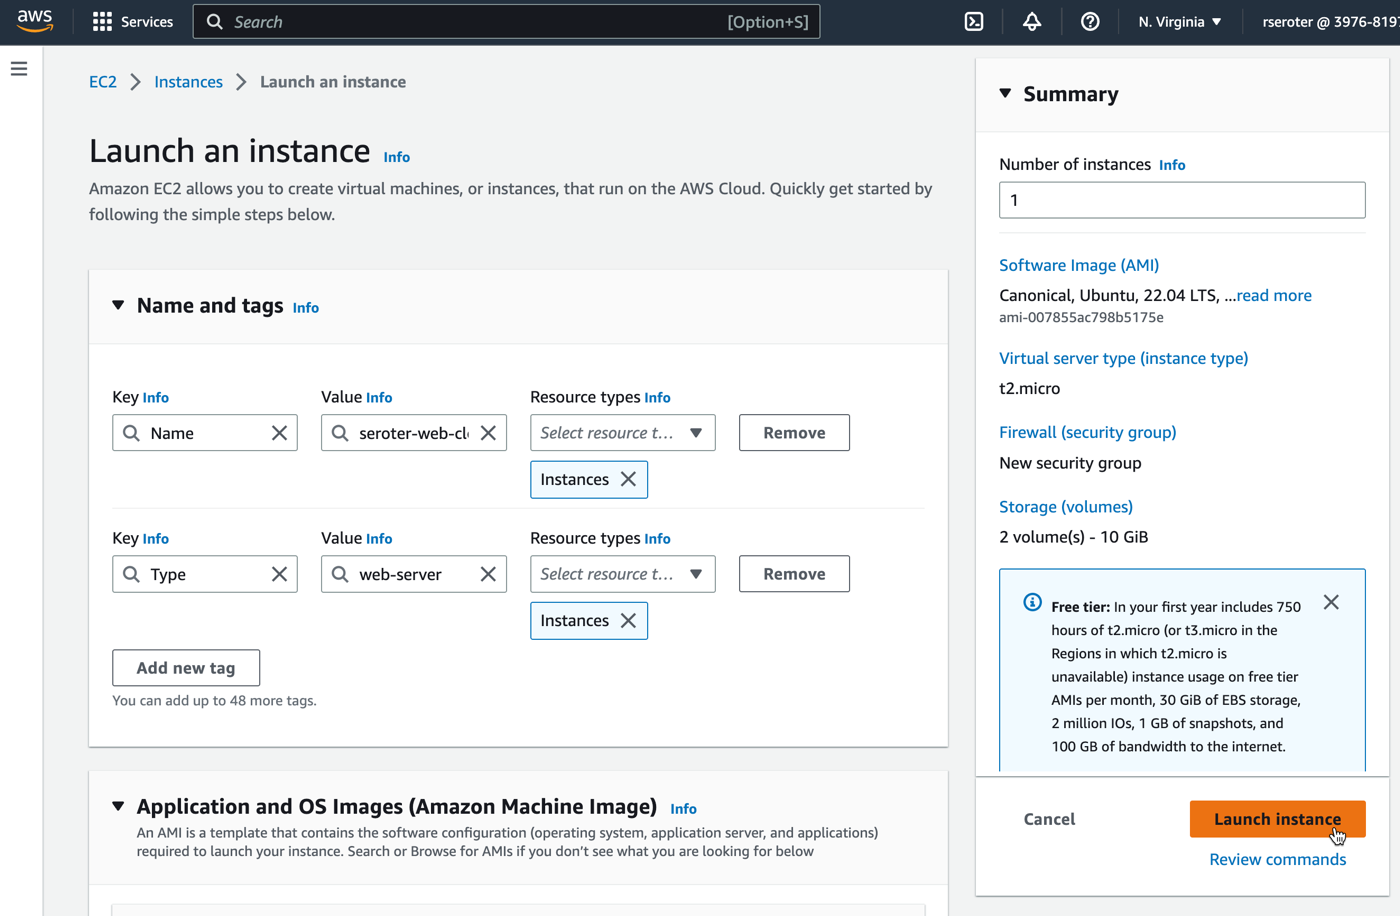
First, I built an Amazon EC2 instance and installed a web server onto it. I added a custom tag with the key “type” and value “web-server” so that I could easily find this VM later. I also added two total volumes in order to see if they successfully move alongside the VM itself.
After a few moments, I had my EC2 instance up and running.
Let’s fast forward for a period of time, and maybe it’s time to evolve and pick my next cloud. I chose Google Cloud, WHICH MUST SHOCK YOU. This workload needs a happier home.
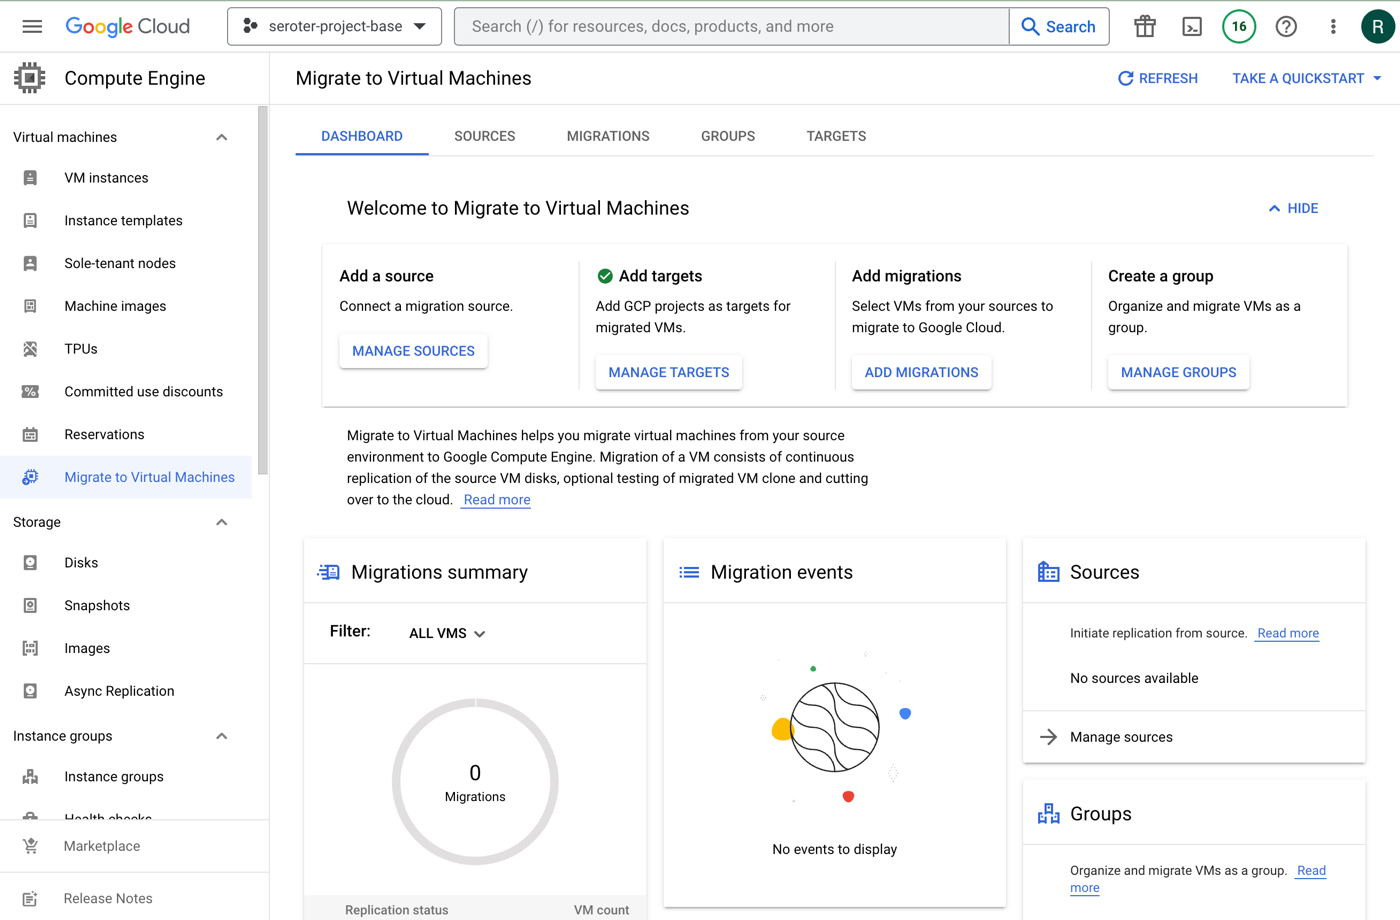
The new Migrate to Virtual Machines experience in the Google Cloud console is pretty sweet. From here, I can add migration sources, target projects, create groups of VMs for migration, and monitor the progress.
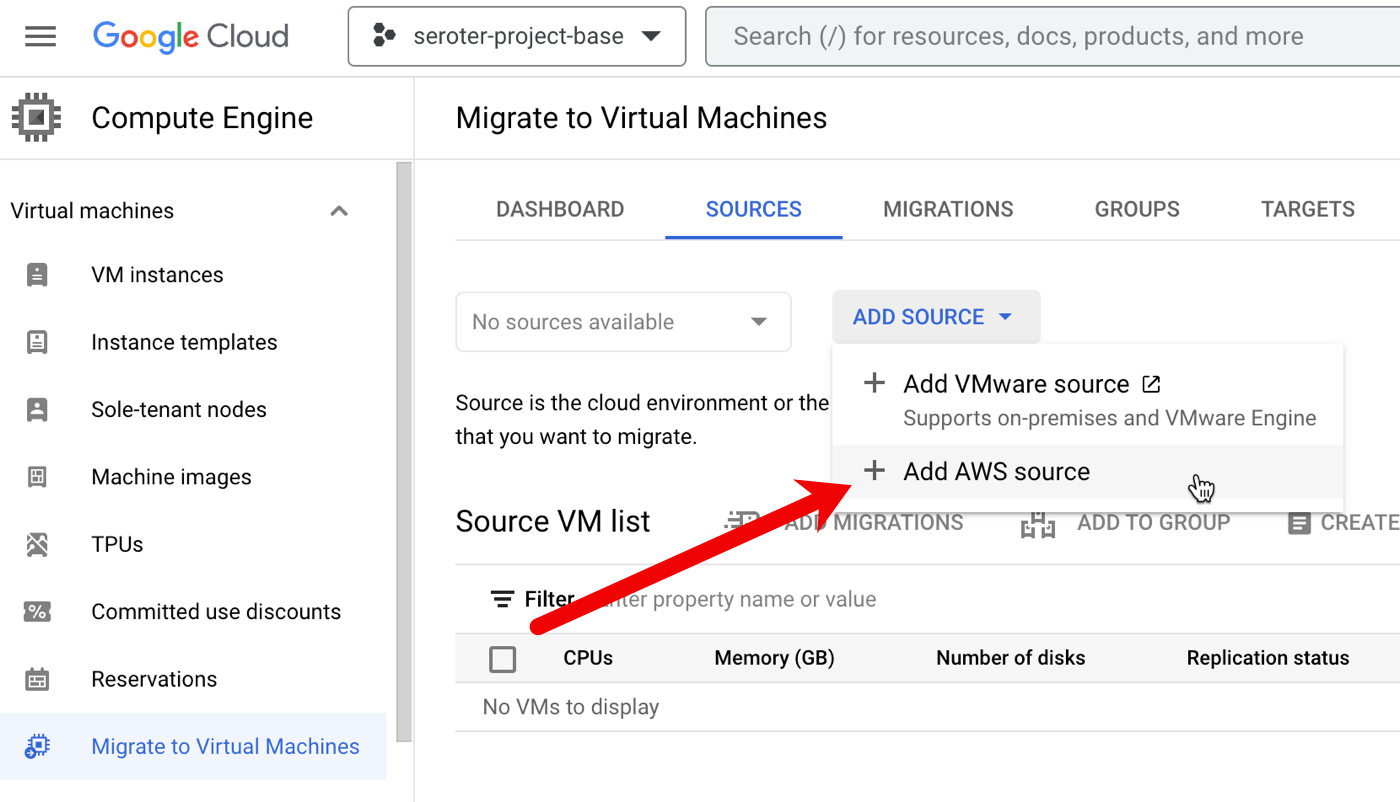
First, I needed to create a source. We recently added AWS as a built-in option. We’ve supported VMware-based migrations for a while now.
I created the “AWS source” by giving it a name, choosing the source AWS region, the target Google Cloud region, and providing credentials to access my account. Also note that I added an (optional) tag to search for when retrieving instances, and an (optional) tag for the migrated VMs.
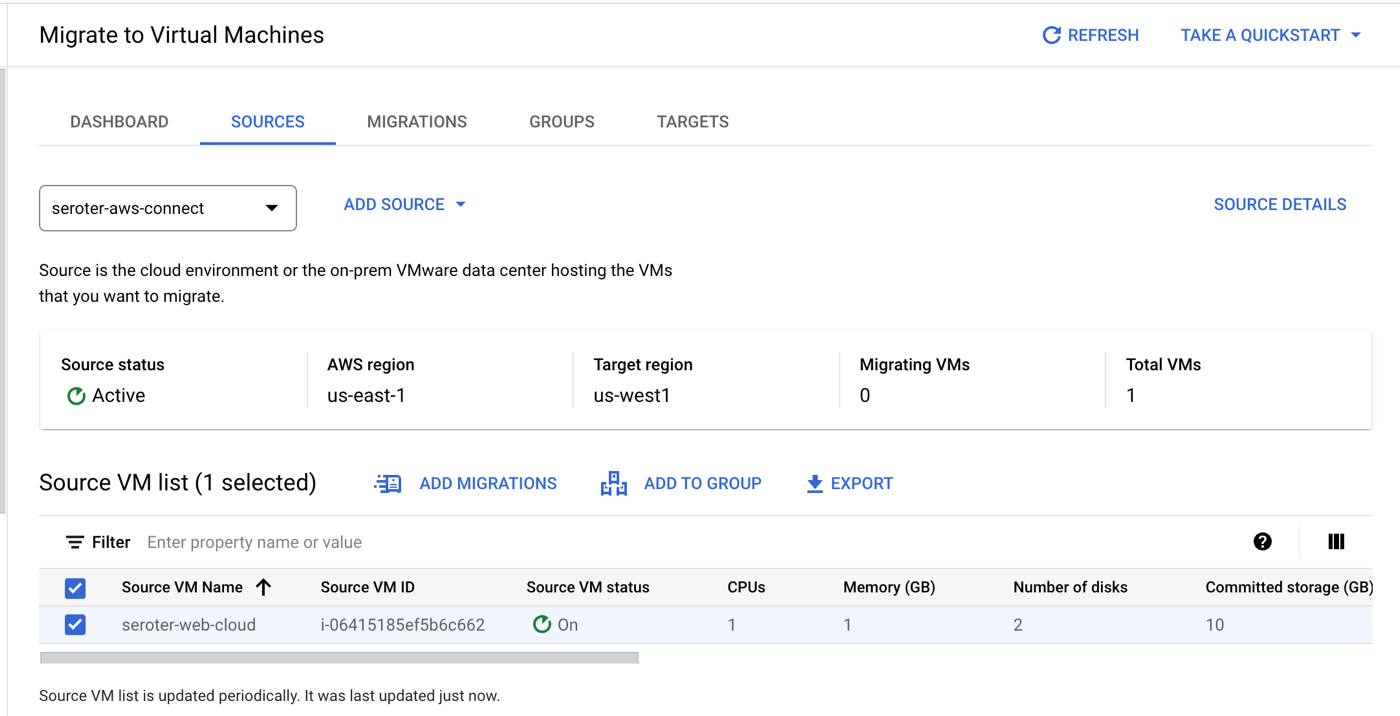
My connection was in a “pending” state for a couple of minutes, and after that, showed me a list of VMs that met the criteria (AWS region, tag). Pretty cool.
From here, I chose that VM and picked the option to “add migration.” This added this particular VM into a migration set. Now I could set the “target” details of the VM in Google Cloud Compute Engine that this AWS image loads into. That means the desired machine name, machine type, network, subnet, and such.
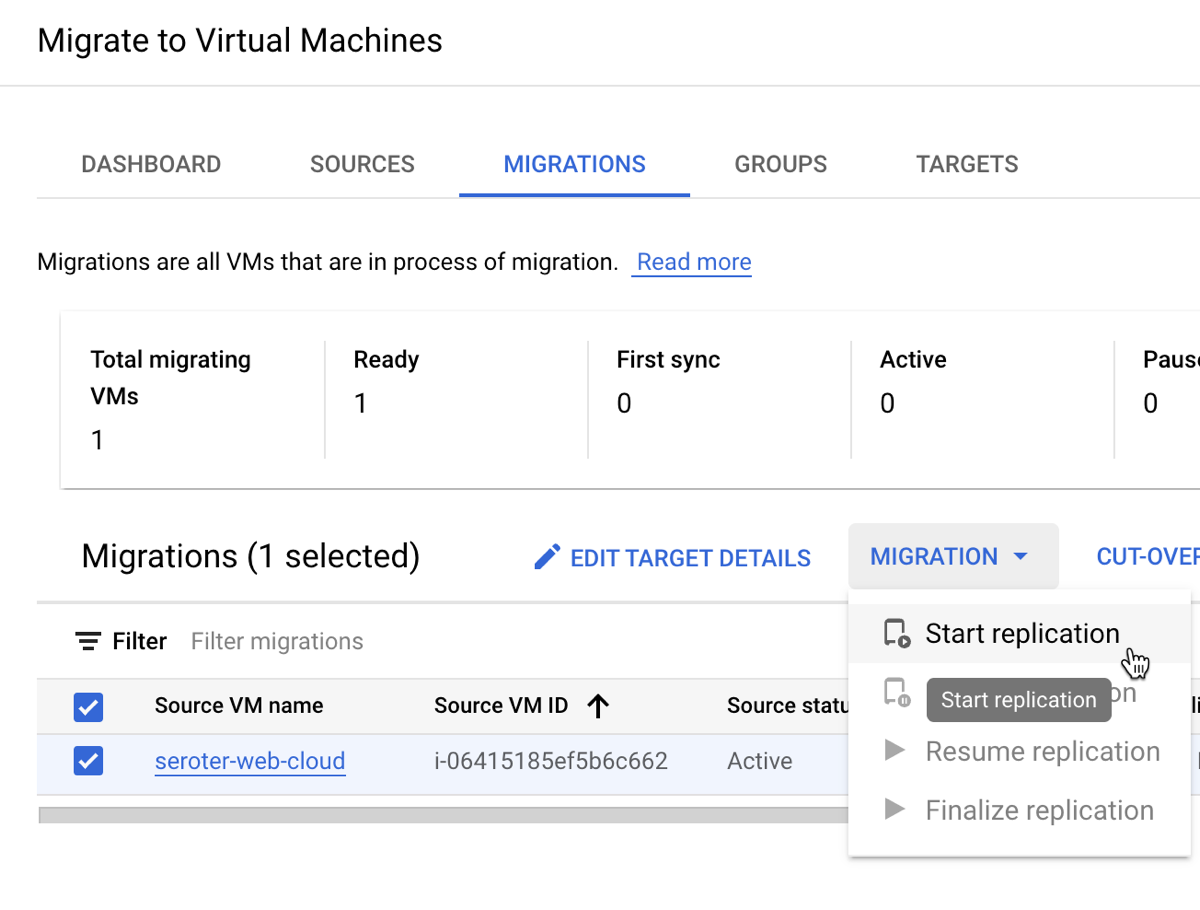
I started the migration. Note that I did not have to stop the VM on AWS for this migration to commence.
When it’s done replicating, I don’t yet have a running VM. My last major step is choosing to do a test-clone phase where I test my app before making it “live”, or, jump right to cut-over. In cut-over, the services takes a final data replica, stops the original VM, and makes a Compute Engine instance using the replicated data.
After a few more minutes, I saw a running Google Cloud Compute Engine VM, and a stopped EC2 instance.
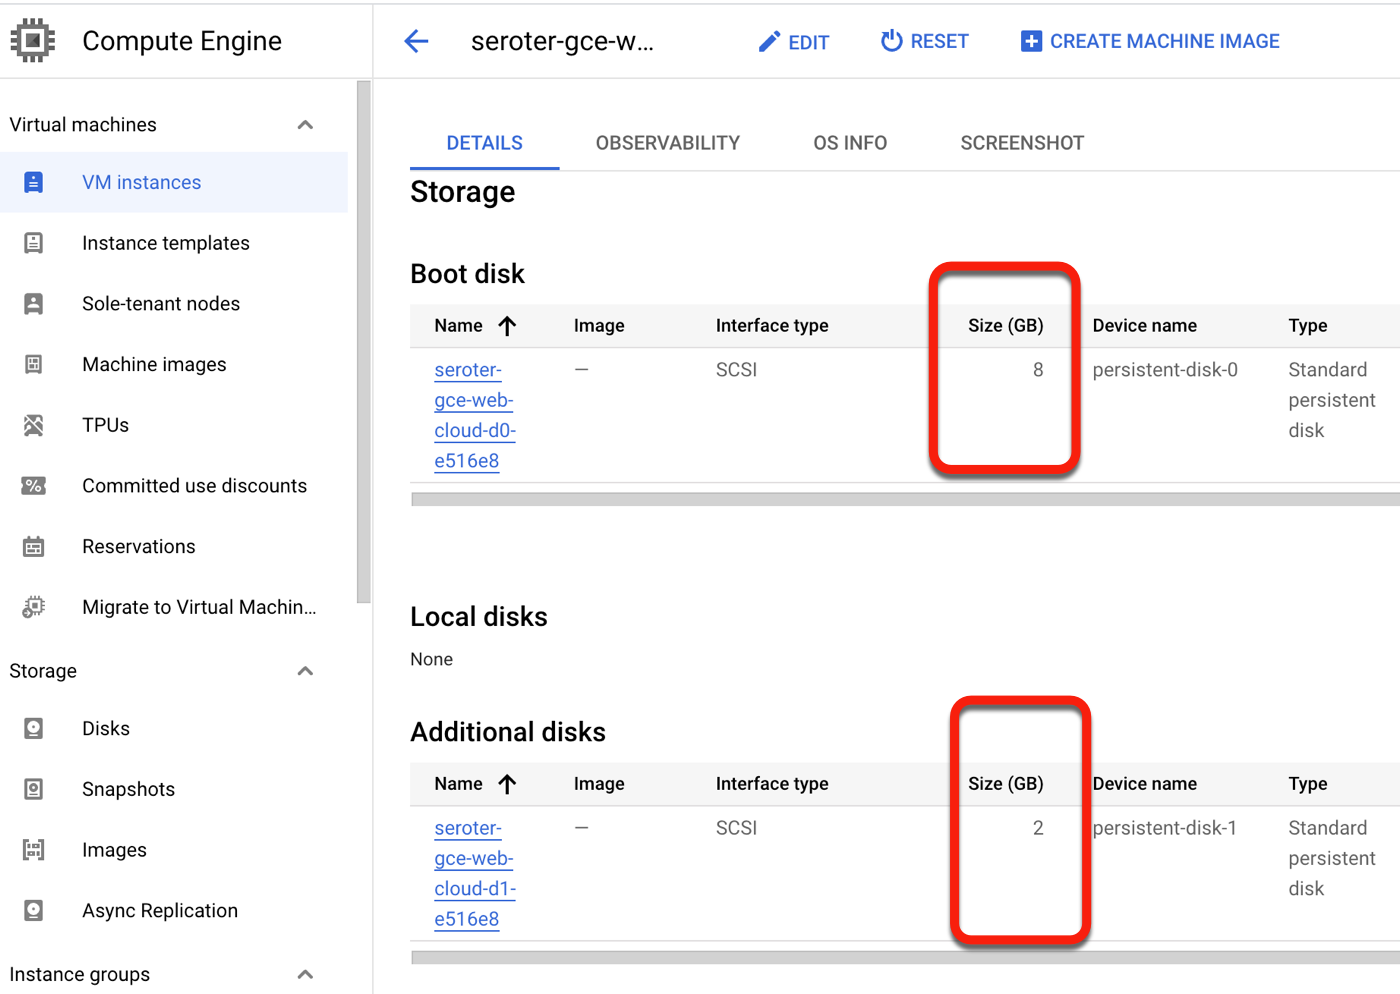
I “finalized” the migration to clean up all the temporary data replicas and the like. After not being sure if this migration experience grabbed the secondary disks from my EC2 instance, I confirmed that yes, we brought them all over. Very nice!
Why do this? The Migrate to Virtual Machines experience offers a clean way to move one or multiple VMs from AWS, vSphere, or Azure (preview) to Google Cloud. There’s very little that you have to do yourself. And I like that it handles the shut down of the initial VM, and offers ways to pause and resume the migration.
The downsides? It’s specific to Google Cloud as a target. You’re not using this to move workloads out of Google Cloud. It’s also not yet available in every single Google Cloud region, but will be soon.
What did I miss? How do you prefer to move your VMs or VM-based workloads around?
A simple use case came to mind yesterday. How would I quickly find out if someone put a too-big file into a repository? In ancient times (let’s say, 2008), here’s what I would have done to solve that. First I’d have to find a file share or FTP location to work with. Then I’d write some custom code with a file system listener that reacted to new documents hitting that file location. After that, I’d look at the size and somehow trigger an alert if the file exceeded some pre-defined threshold. Of course, I’d have to find a server to host this little app on, and figure out how to deploy it. So, solving this might take a month or more. Today? Serverless, baby! I can address this use case in minutes.
I’m learning to program in Go, so ideally, I want a lightweight serverless function written in Go that reacts whenever a new file hits an object store. Is that easy to do in each major public cloud entirely with the console UIs? I just went on a journey to find out, without preparing ahead of time, and am sharing my findings in real time.
Disclaimer: I work at Google Cloud but I am a fairly regular user of other clouds, and was a 12-time Microsoft MVP, mostly focused on Azure. Any mistakes below can be attributed to my well-documented ignorance, and not about me trying to create FUD!
Google Cloud
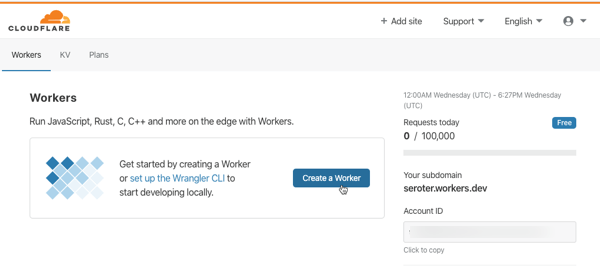
First up, the folks paying my salary. How easily could I add a Cloud Function that responds to things getting uploaded to Cloud Storage?
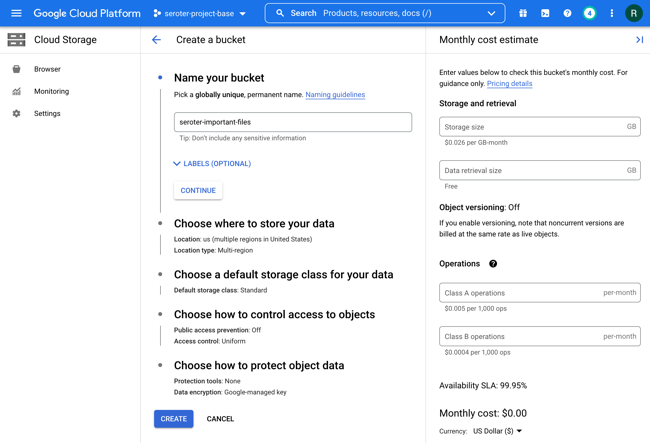
First, I created a new bucket. This takes a few seconds to do.
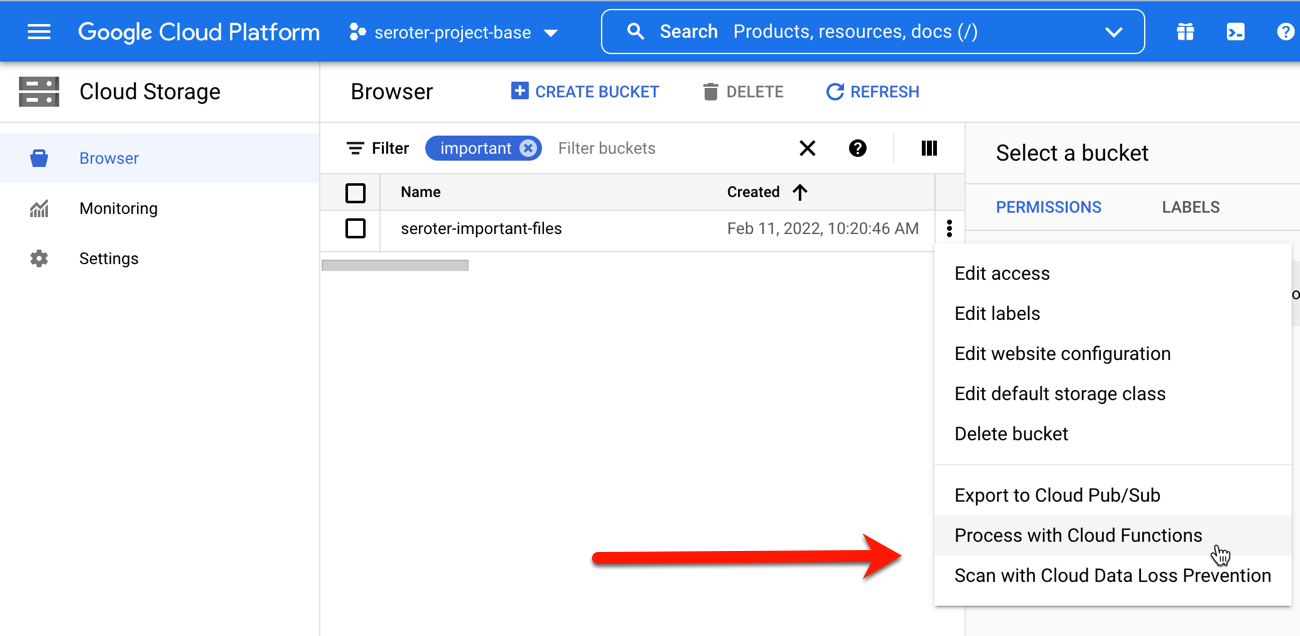
Hey, what’s this? From the bucket browser, I can actually choose to “process with Cloud Functions.” Let’s see what this does.
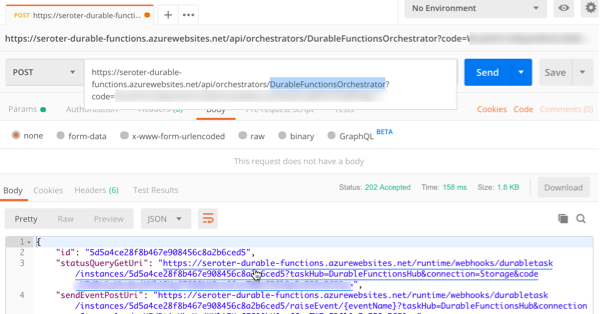
Whoa. I get an inline “create function” experience with my bucket-name pre-populated, and the ability to actually author the function code RIGHT HERE.
The Go code template was already populated with a “storage” object as input, and I extended it to include the “size” attribute. Then I added a quick type conversion, and check to see if the detected file was over 1MB.
// Package p contains a Google Cloud Storage Cloud Function.
package p

import (
	"context"
	"log"
	"strconv"
)

// GCSEvent is the payload of a GCS event. Please refer to the docs for
// additional information regarding GCS events.
type GCSEvent struct {
	Bucket string `json:"bucket"`
	Name   string `json:"name"`
	Size   string `json:"size"`
}

// HelloGCS prints a message when a file is changed in a Cloud Storage bucket.
func HelloGCS(ctx context.Context, e GCSEvent) error {
	log.Printf("Processing file: %s", e.Name)

	intSize, _ := strconv.Atoi(e.Size)

	if intSize > 1000000 {
		log.Printf("Big file detected, do something!")
	} else {
		log.Printf("Normal size file detected")
	}

	return nil
}
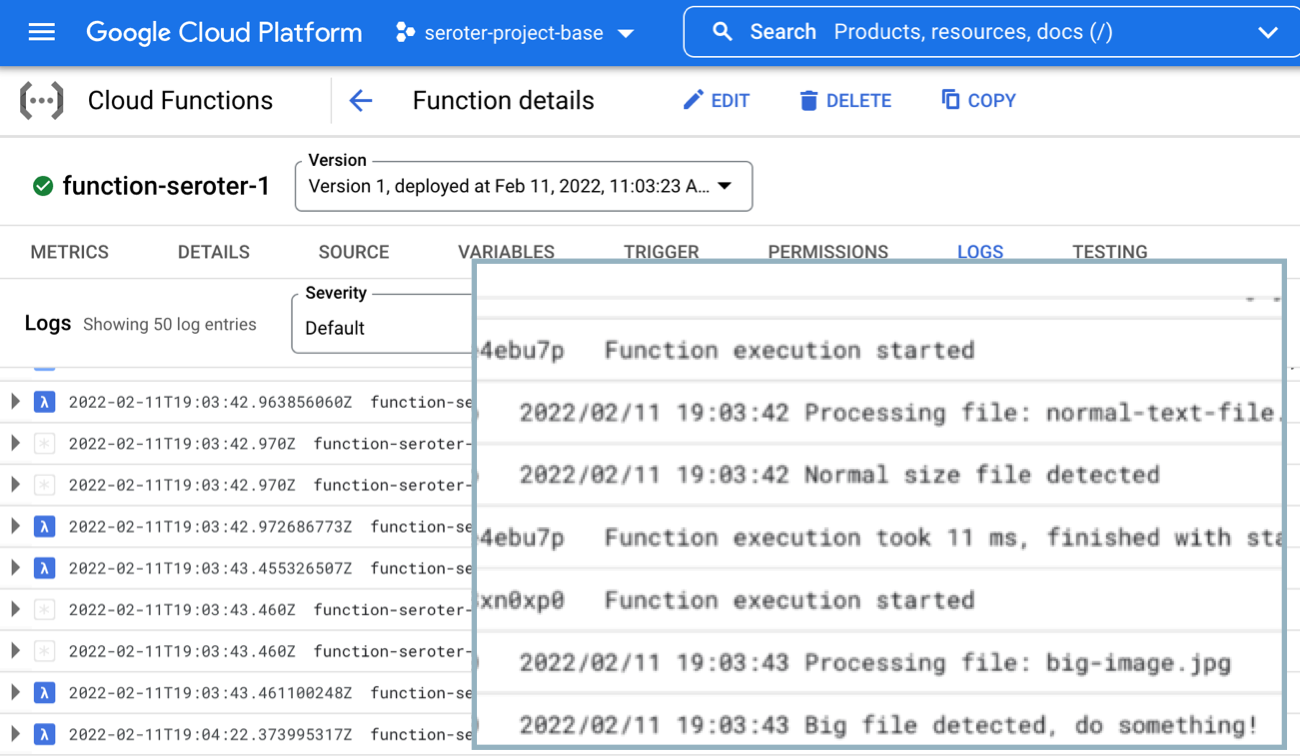
After deploying it, I want to test it. To do so, I just dropped two files—one that was 54 bytes and another that was over 1MB.
Now I’m heading over to the Cloud Functions dashboard and looking at the inline “Logs” tab. This shows me the system logs, as well as anything my function itself emitted. After just a moment, I see the logs my function wrote out, including the “normal size file” and “big file detected” messages.
Goodness that was easy. The same sort of in-experience trigger exists for Pub/Sub, making it easy to generate functions that respond to messaging events.
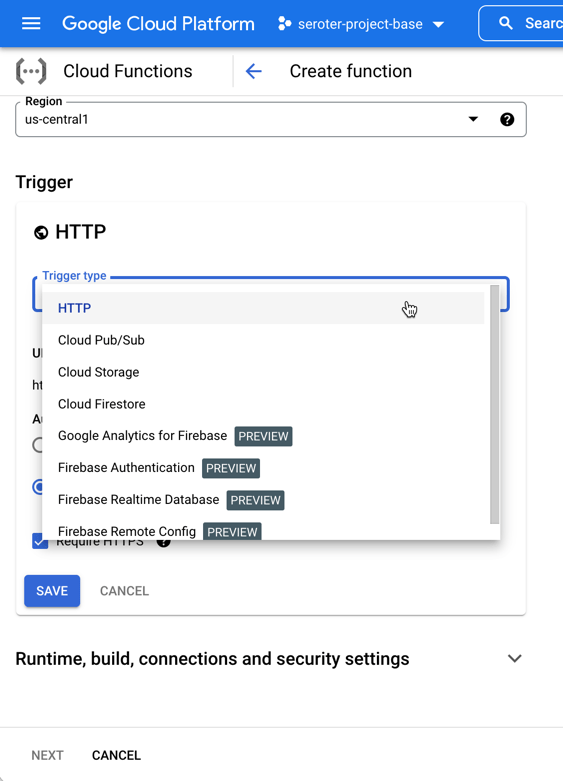
The other UI-driven way to do this. From the Cloud Functions experience, I chose to add a new function. You see here that I have a choice of “trigger.”
I chose “Cloud Storage” and then picked from a list of possible event types. Let’s also choose the right bucket to listen in on. Note that from this creation wizard, I can also do things like set the memory allocation and timeout period, define the minimum and maximum instance count, add environment variables, reference secrets, and define ingress and egress permissions.
Next, I have to add some source code. I can upload a zip file, reference a zip file in Cloud Storage, point to a source code repository, or add code inline. Let’s do that. What I love is that the code template recognizes my trigger type, and takes in the object representing the storage event. For each language. That’s a big time-saver, and helps new folks understand what the input object should look like. See here:
Here, I picked Go again, used the same code as before, and deployed my function. Once again, it cleanly processes any event related to new files getting added to Cloud Storage. Cloud Functions is underrated, and super easy to work with.
End to end, this solution should take 2-5 minutes tops to complete and deploy. That’s awesome. Past Richard would be crying for joy right now.
AWS
The grandaddy of serverless should be pretty good at this scenario too! From humble beginnings, AWS Lambda has seemingly becomes the preferred app platform in that ecosystem. Let’s use the AWS console experience to build a Lambda function that responds to new files landing in an S3 bucket.
First, I need an S3 bucket. Easy enough, and accepting all the default settings.
My bucket is now there, and I’m looking around, but don’t see any option to create a Lambda function from within this S3 interface. Maybe I’m missing it, but doesn’t seem so.
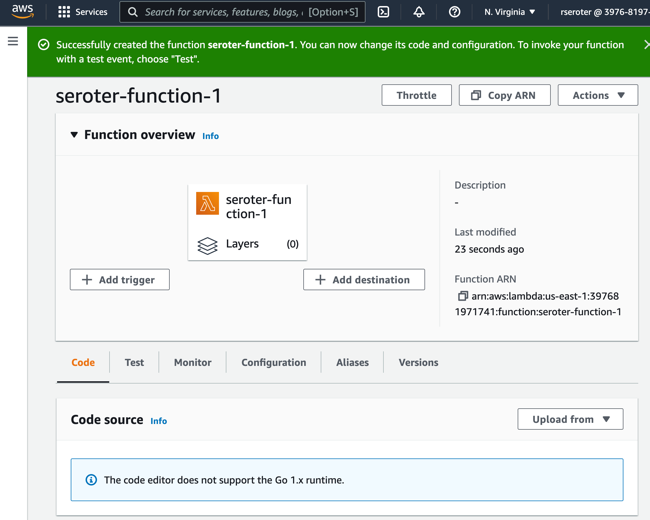
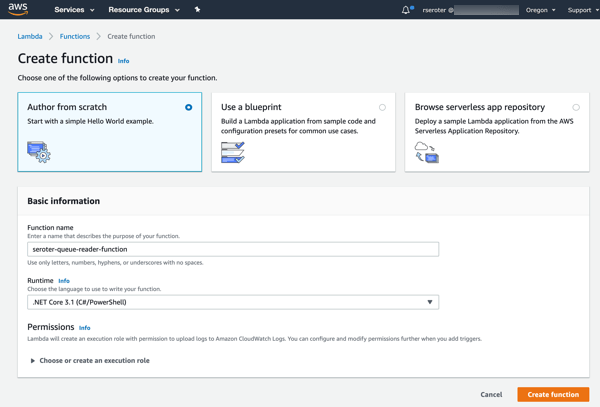
No problem. Off to the Lambda dashboard. I click the very obvious “create function” button and am presented with a screen that asks for my function name and runtime, and the source of code.
Let’s see what “from scratch” means, as I’d probably want some help via a template if it’s too bare bones. I click “create function” to move forward.
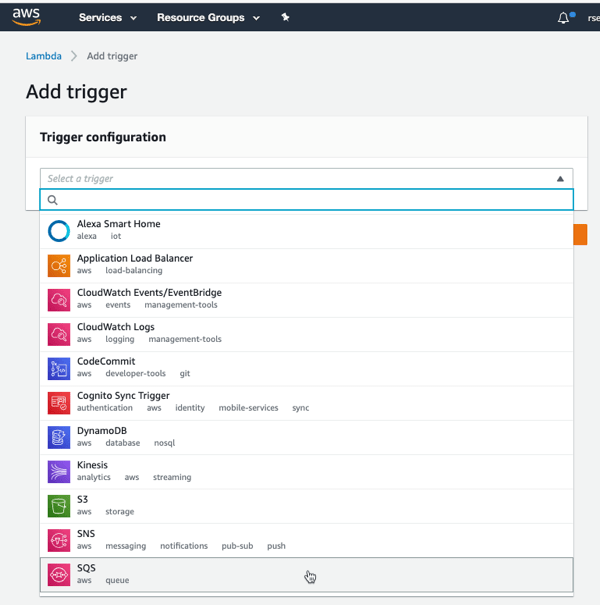
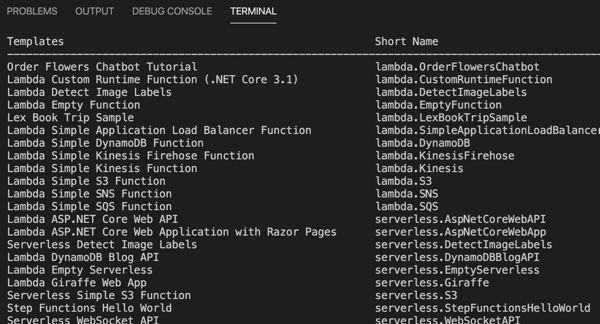
Ok, rats, I don’t get an inline code editor if I want to write code in Go. Would have been useful to know beforehand. I’ll delete this function and start over, this time, looking for a blueprint that might provide a Go template for reading from S3.
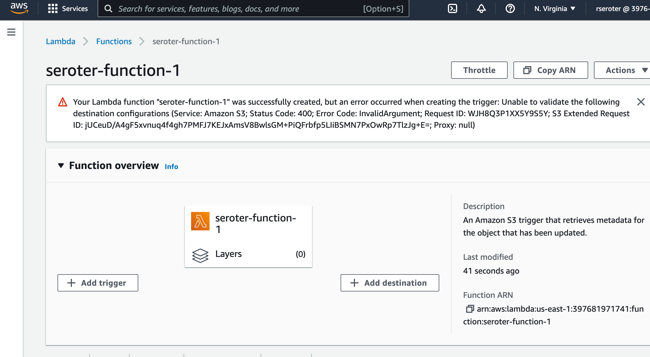
Doesn’t look like there’s anything for Go. If I want a blueprint, I’m choosing between Python and Node. Ok, I’ll drop by Go requirement, and crank out this Lambda function in JavaScript. I picked that s3-get-object template, and then provide a function name and a role that can access S3. I’m asked for details about my S3 trigger (bucket name, event type) and shown the (uneditable) blueprint code. I’d like to make changes, but I guess I wait until later, so I create the function.
Shoot, I did something wrong. Got an error that, on the plus side, is completely opaque and unreadable.
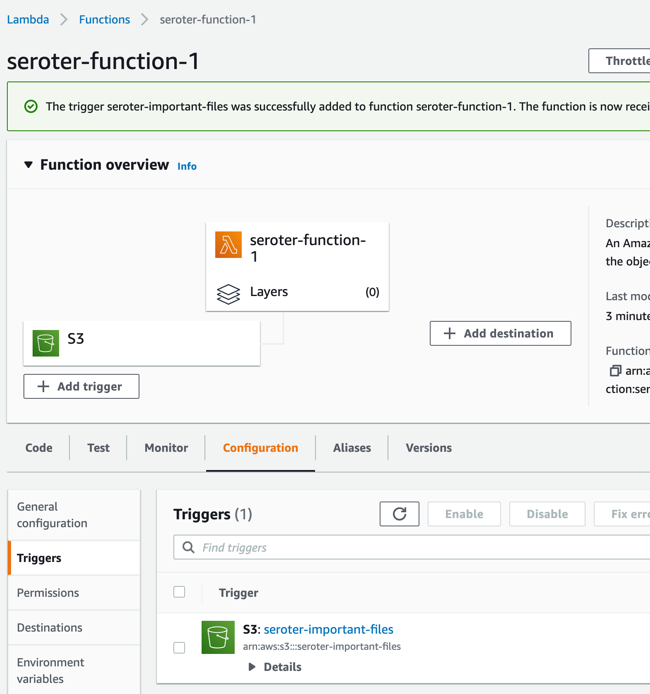
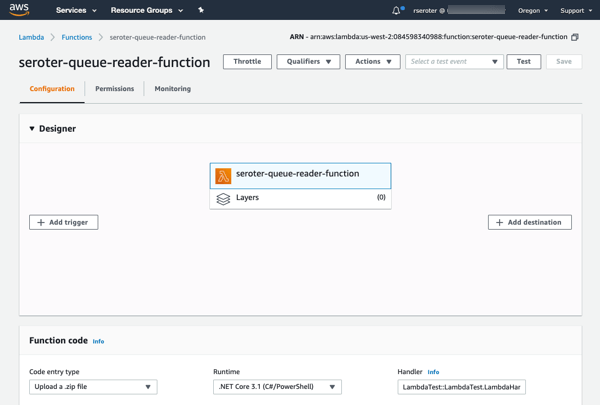
Not be stopped, I’ll try clicking “add trigger” here, which lets me choose among a variety of sources, including S3, and this configuration seems to work fine.
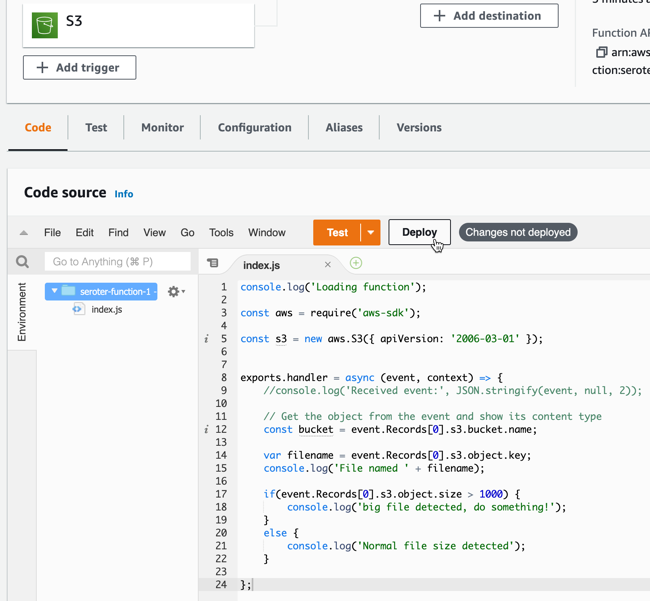
I want to update the source code of my function, so that it logs alerts for big files. I updated the Lambda code (after looking up the structure of the inbound event object) and clicked “deploy” to apply this new code.
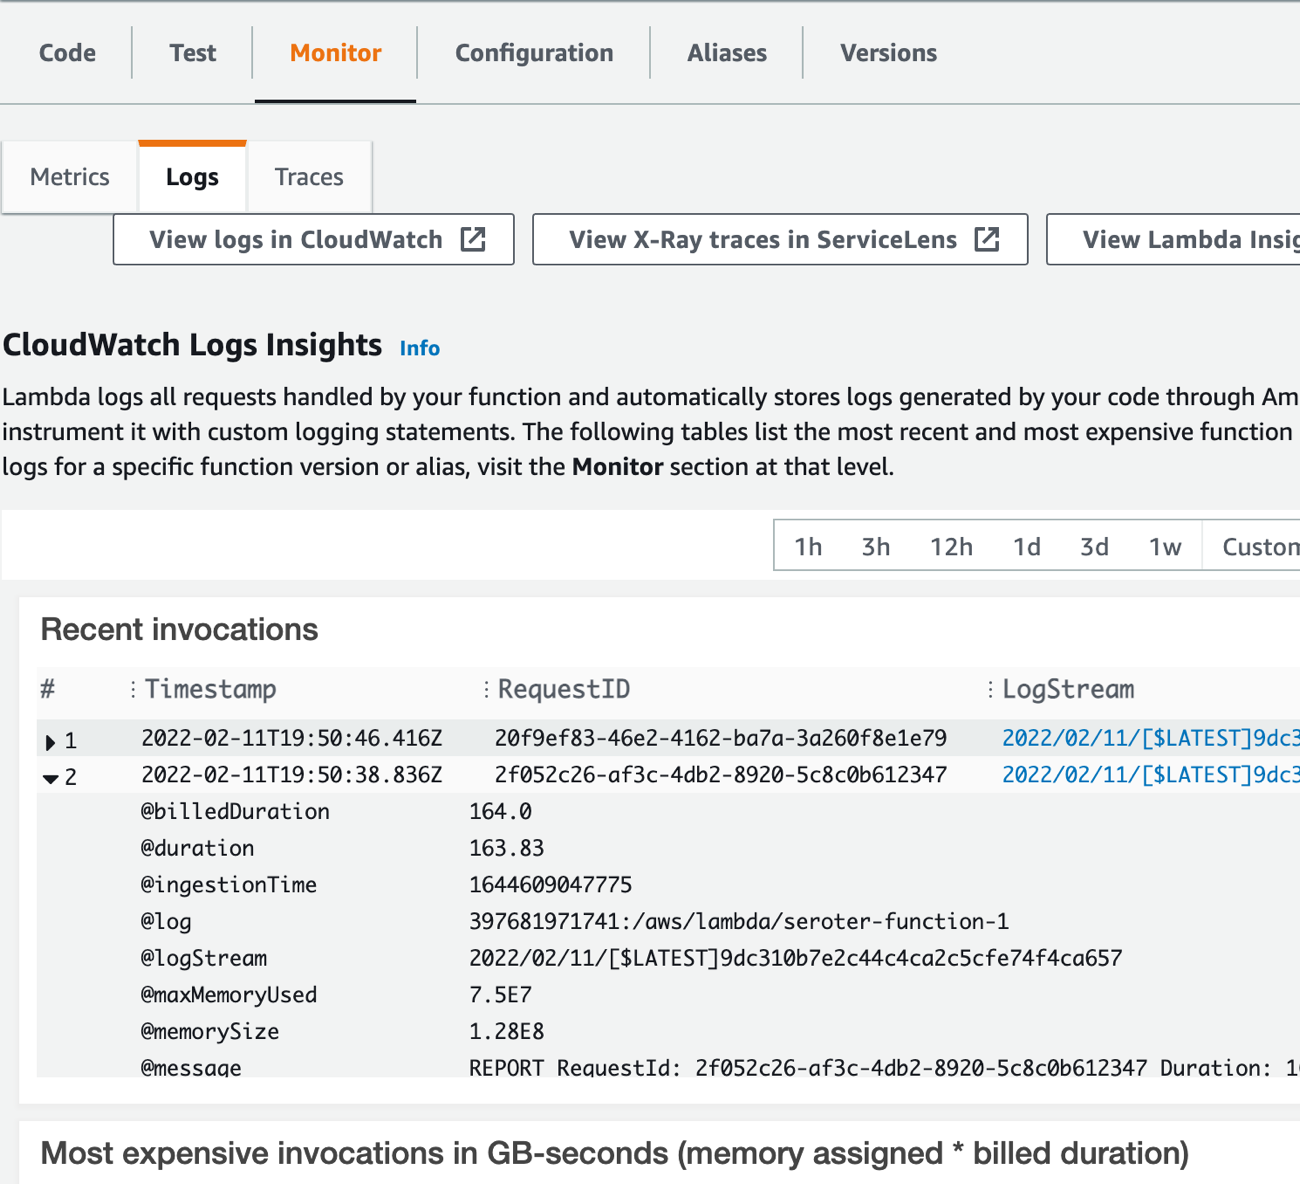
Not too bad. Ok, let’s test this. In S3, I just dropped a handful of files into the bucket. Back in the Lambda console, I jump to the “Monitor” tab to see what’s up.
I’ve got the invocations listed here. I can’t see the logs directly, but looks like I need to click the LogStream links to view the invocation logs. Doing that takes me to a new window where I’m now in CloudWatch. I now see the logs for this particular set of invocations.
Solid experience. A few hiccups, but we’ll chalk some of that up to my incompetence, and the remainder to the fact that AWS UIs aren’t always the most intuitive.
Microsoft Azure
Azure, my old friend. Let’s see how I can use the Azure Portal to trigger an Azure Function whenever I add something to a storage bucket. Here we go.
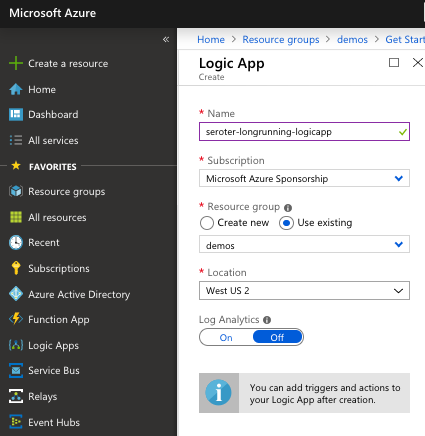
Like with the walkthroughs above, I also need to setup some storage. From the home page, I click “create resource” and navigate on the left-hand side to “Storage.” And … don’t see Azure Storage. *Expletive*.
I can’t find what category it’s in, but just noticed it in the “Get started” section. It’s weird, but whatever. I pick an Azure subscription and resource group, try to set a name (and remember that it doesn’t accept anything but letters and numbers, no dashes), and proceed. It validates something (not sure I’ve ever seen this NOT pass) and then I can click “create.”
After thirty seconds, I have my storage account. Azure loves “things contained within things” so this storage account itself doesn’t hold objects. I create a “container” to hold my actual documents.
Like with Lambda, I don’t see a way from this service to create an event-driven function. [Updated 2-13-22: A reader pointed out that there is an “events” experience in Storage that lets you somewhat create a function (but not the Function App itself). While convenient, the wizard doesn’t recognize where you are, and asks what sort of Function (storage!) you want to build. But it’s definitely something.]
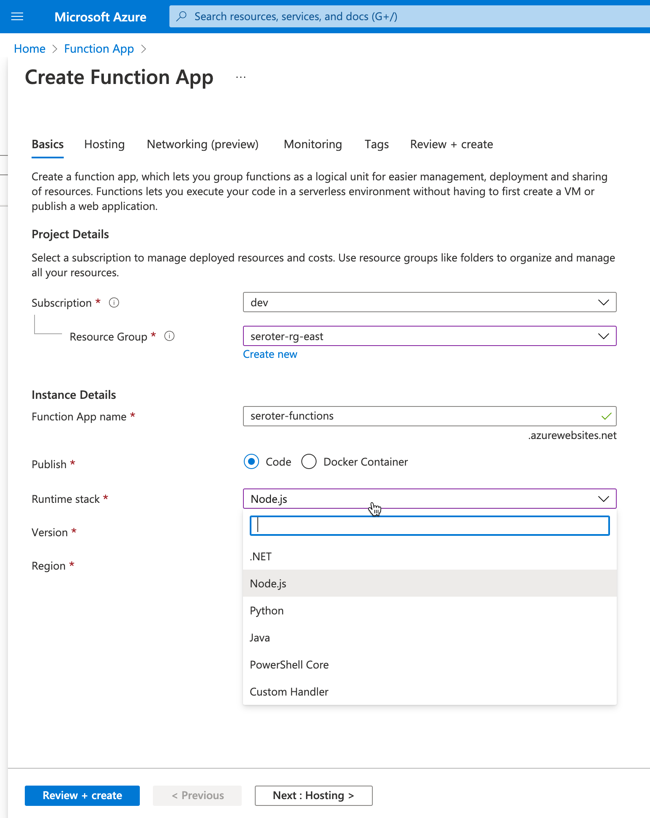
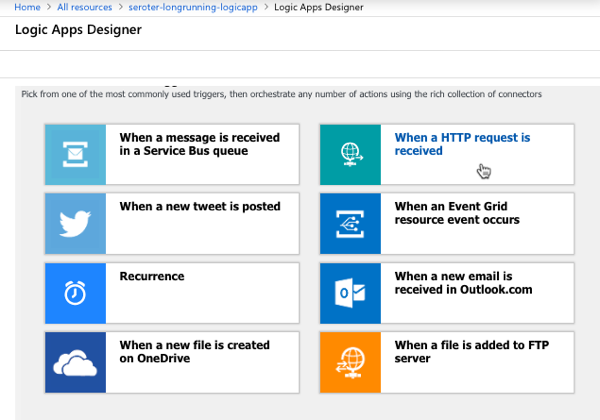
So, let’s go to the Azure Functions experience. I’m asked to create a “Function App.” There’s no option to choose Go as a managed language, so I’ll once again pick Node. YOU WIN AGAIN JAVASCRIPT.
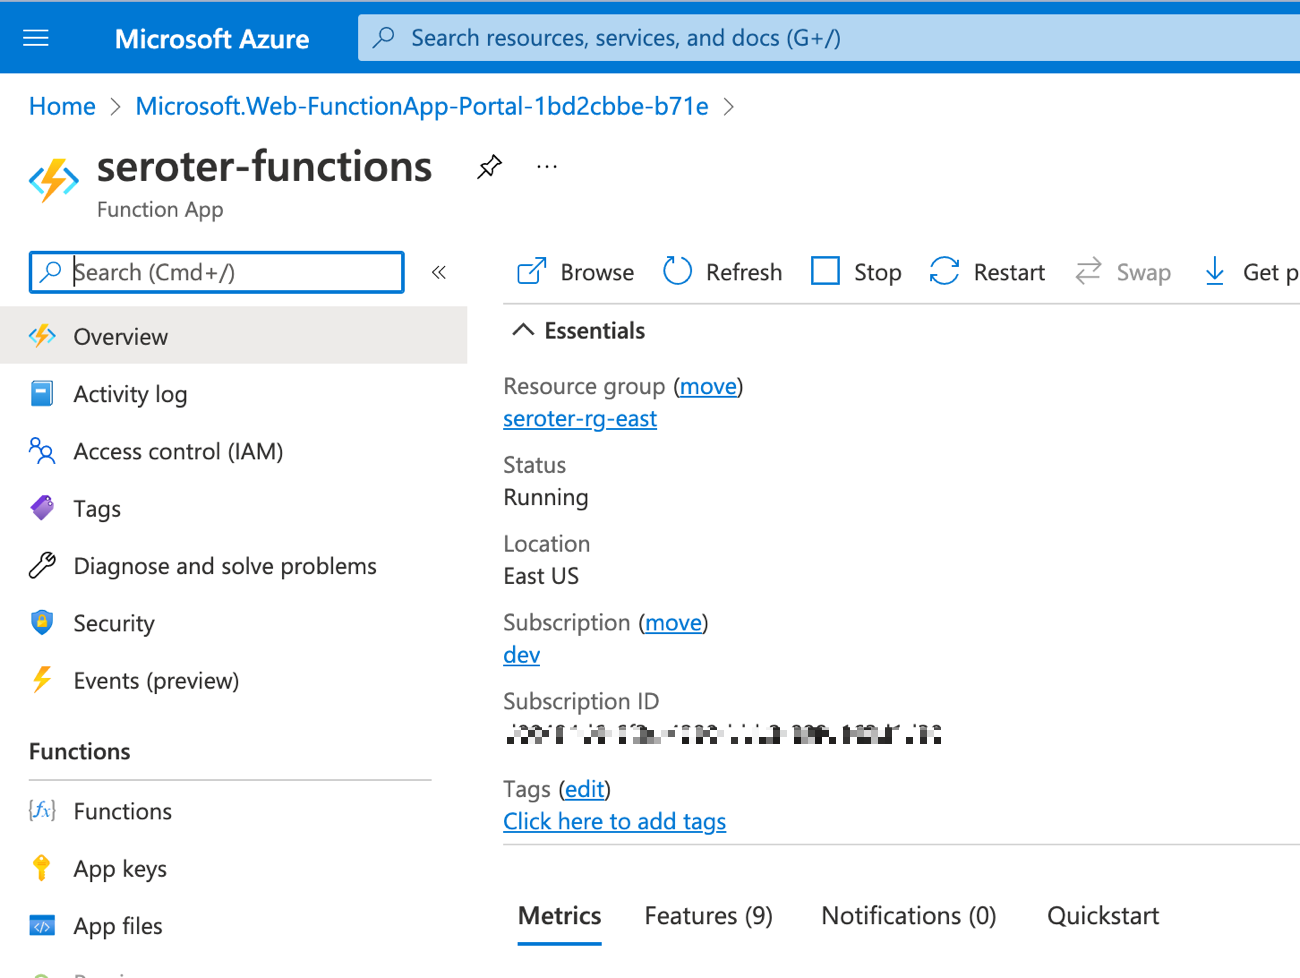
I move on to the next pane of the wizard where I’m asked about hosting stack. Since this is 2022, I chose Linux, even though Windows is somehow the recommended stack for Node functions. After a few moments, I have my Function app.
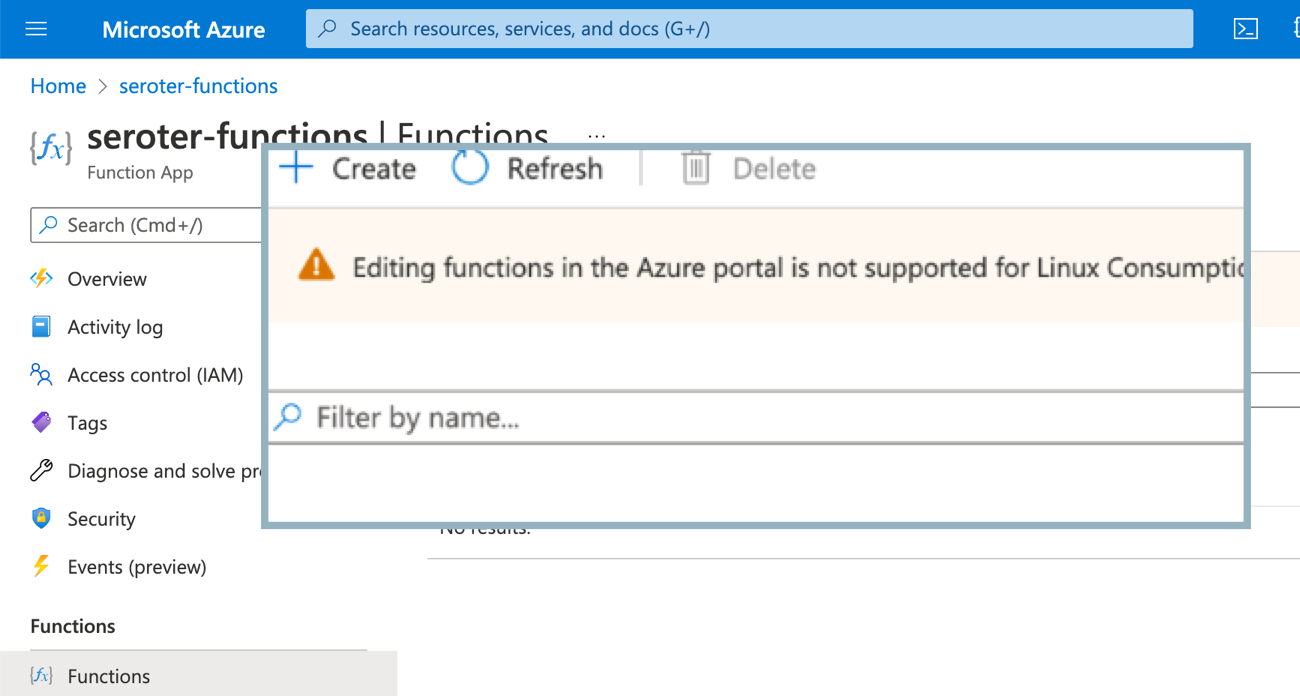
As with the storage scenario, this Function app isn’t actually the function. I need to add a function to the app. Ok, no problem. Wait, apparently you can’t use the inline editor for Linux-based functions because of reasons.
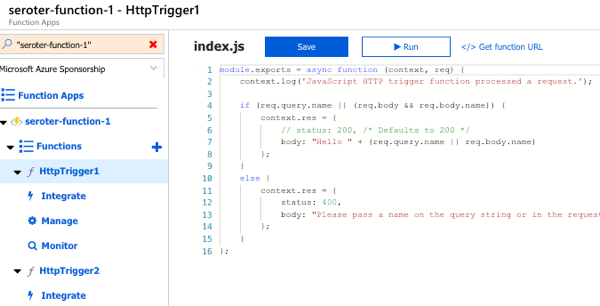
Sigh. I’ll create a new Function App, this time choosing Windows as the host. Now when I choose to add a function to this Function App, I see the option for “develop in portal”, and can choose a trigger. That’s good. I’ll choose the Storage Blob trigger, but I’m not clear on the parameter values I’m supposed to provide. Hmm, the “learn more” goes to a broken page. Found it by Googling directly. Looks like the “path” is the name of the container in the account, and {name} is a standard token.
The creation succeeded, and now I have a function. Sweet. Let’s throw some code in here. The “Code + Test” window looks like an inline editor. I updated the code to do a quick check of file size, and hope it works.
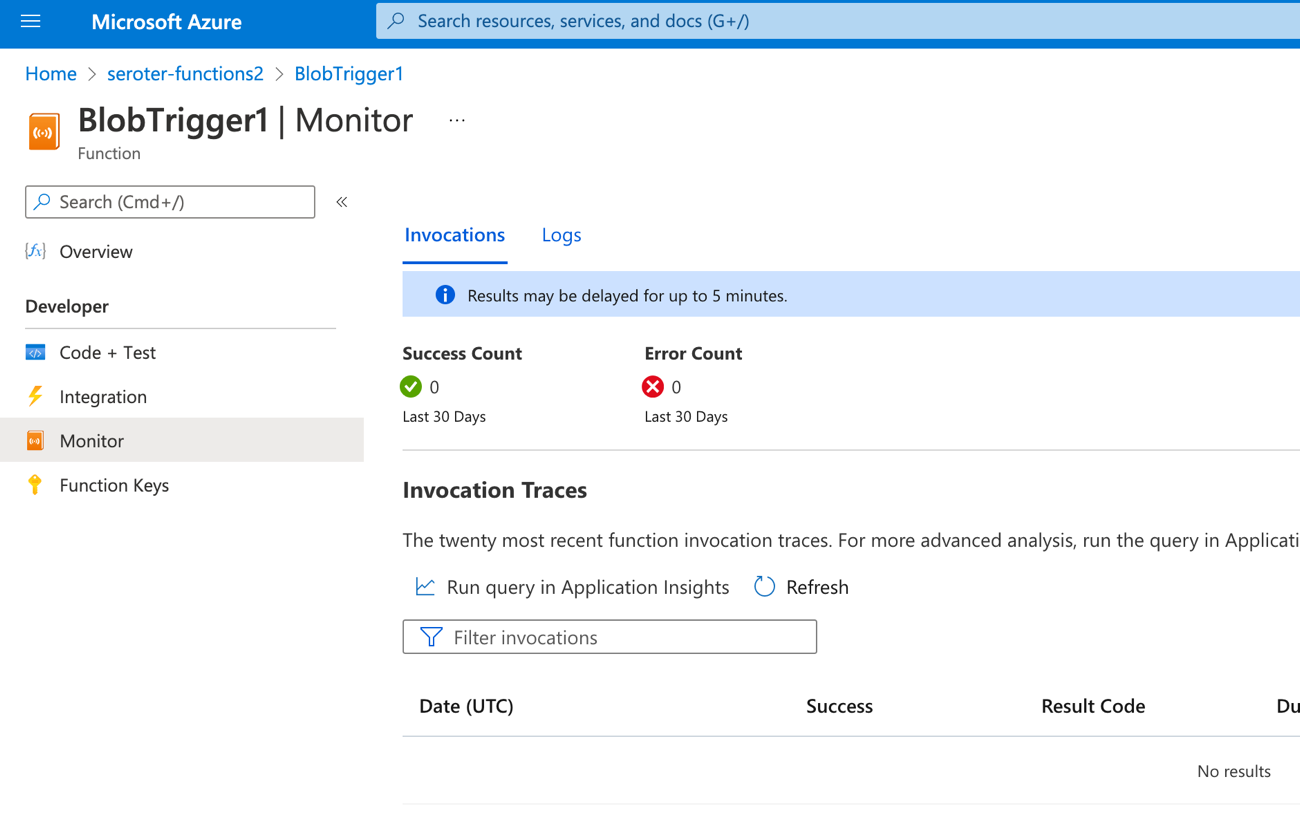
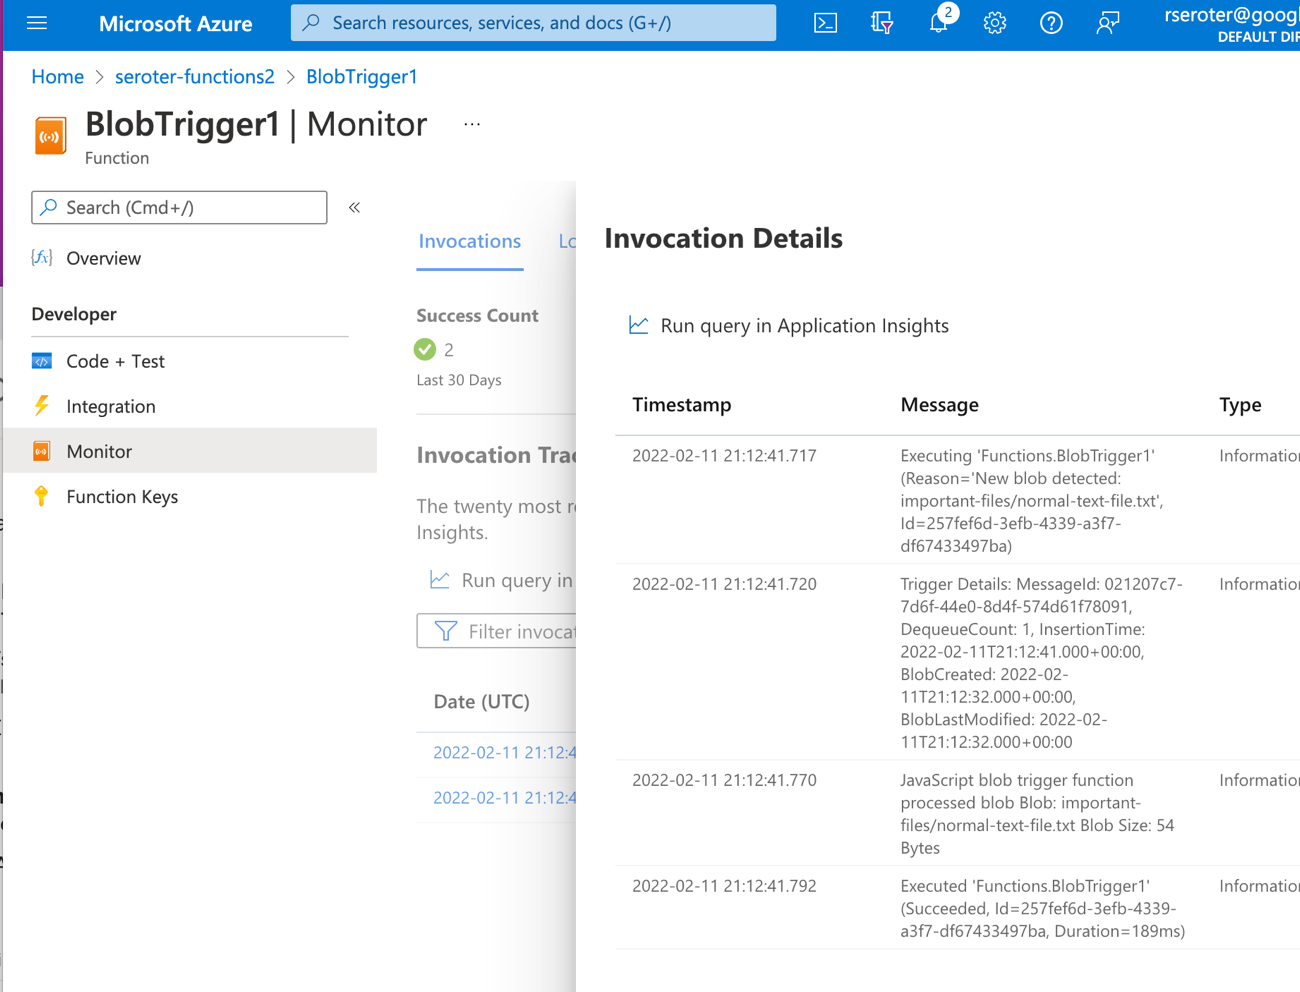
After saving it (I don’t see a concept of versioning), I can test it out. Like I did for Google Cloud and AWS, I dragged a couple of files onto the browser window pointing at the Storage Blob. Looks like the Azure Portal doesn’t support drag-and-drop. I’ll use the “upload files” wizard like an animal. After uploading, I switch back to the Azure Functions view which offers a “Monitor” view.
I don’t love that “results may be delayed for up to 5 minutes” as I’m really into instant gratification. The Function dashboard shows two executions right away, but the logs are still delayed for minutes after that. Eventually I see the invocations show up, and it shows execution history (not app logs).
I can’t seem to find the application logs, as the “logs” tab here seems to show a stream, but nothing appears here for me. Application Insights doesn’t seem to show the logs either. They could be lost to the universe, or more likely, I’m too bad at this to find them.
Regardless, it works! My Azure Function runs when objects land in my Storage account.
Wrap Up
As to the options considered here, it seemed obvious to me that Google Cloud has the best dev experience. The process of creating a function is simple (and even embedded in related services), the inline editor easily works for all languages, and the integrated log monitoring made my build-deploy-test loop faster. The AWS experience was fine overall, although inconsistent depending on your programming language. And the Azure experience, honestly, felt super clunky and the Windows-centricity feels dated. I’m sure they’ll catch up soon.
Overall, this was pretty fun. Managed services and serverless computing makes these quick solutions so simple to address. It’s such an improvement for how we had to do this before!
Configurability matters. Whether it’s in our code editors, database engine, or compute runtimes, we want the option—even if we don’t regularly use it—to shape software to our needs. When it comes to using that software as a service, we also look for configurations related to quality attributes—think availability, resilience, security, and manageability.
For something like Kubernetes—a hyper-configurable platform on its own—you want a cloud service that makes this powerful software more resilient and cheaper to operate. This blog post focuses on configurability of each major Kubernetes service in the public cloud. I’ll make that judgement based on the provisioning options offered by each cloud.
Disclaimer: I work for Google Cloud, so obviously I’ll have some biases. That said, I’ve used AWS for over a decade, was an Azure MVP for years, and can be mostly fair when comparing products and services. Please call out any mistakes I make!
Google Kubernetes Engine (GKE)
GKE was the first Kubernetes service available in the public cloud. It’s got a lot of features to explore. Let’s check it out.
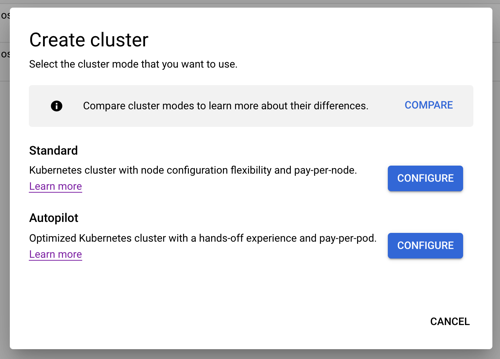
When creating a cluster, we’re immediately presented with two choices: standard cluster, or Autopilot cluster. The difference? A standard cluster gives the user full control of cluster configuration, and ownership of day-2 responsibilities like upgrades. An Autopilot cluster—which is still a GKE cluster—has a default configuration based on Google best practices, and all day-2 activities are managed by Google Cloud. This is ideal for developers who want the Kubernetes API but none of the management. For this evaluation, let’s consider the standard cluster type.
If the thought of all these configurations feels intimidating, you’ll like that GKE offers a “my first cluster” button which spins up a small instance with a default configuration. Also, this first “create cluster” tab has a “create” button at the bottom that provisions a regular (3-node) cluster without requiring you to enter or change any configuration values. Basically, you can get started with GKE in three clicks.
With that said, let’s look at the full set of provisioning configurations. On the left side of the “create a Kubernetes cluster” experience, you see the list of configuration categories.
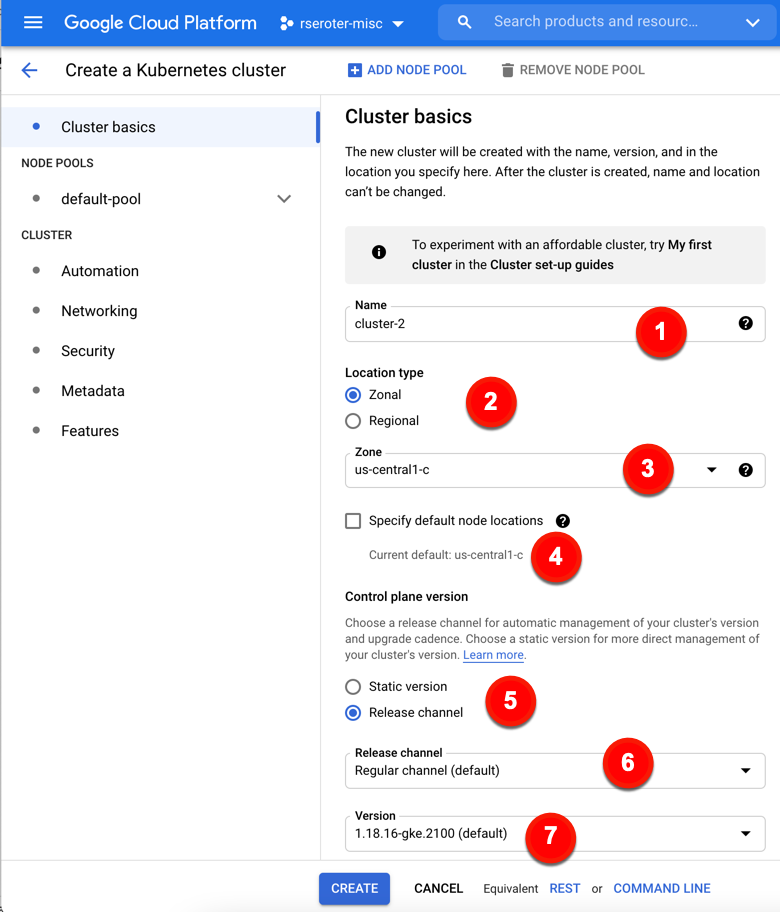
How about we look at the specific configurations. On the cluster basics tab, we have seven configuration decisions to make (or keep, if you just want to accept default values). These configurations include:
1. Name. Naming is hard. These are 40 characters long, and permanent.
2. Location type. Where do you want your control plane and nodes? Zonal clusters only live in a chosen zone, while Regional clusters spread the control plane and workers across zones in a region.
3. Zone/Region. For zonal clusters, you pick a zone, for regional clusters, you pick a region.
4. Specify default node locations. Choose which zone(s) to deploy to.
5. Control plane version. GKE provisions and offers management of control plane AND worker nodes. Here, you choose whether you want to pick a static Kubernetes version and handle upgrades yourself, or a “release channel” where Google Cloud manages the upgrade cadence.
6. Release channel. If you chose release channel vs static, you get a configuration choice of which channel. Options include “rapid” (get Kubernetes versions right away), “regular” (get Kubernetes versions after a period of qualification), and “stable” (longer validation period).
7. Version. Whether choosing “static” or “release channel”, you configure which version you want to start with.
You see in the picture that I can click “Create” here and be done. But I want to explore all the possible configurations at my disposal with GKE.
My next (optional) set of configurations relates to node pools. A GKE cluster must have at least one node pool, which consists of an identical group of nodes. A cluster can have many node pools. You might want a separate pool for Windows nodes, or a bigger machine type, or faster storage.
In this batch of configurations, we have:
8. Add node pool. Here you have a choice on whether to stick with a single default node pool, or add others. You can add and remove node pools after cluster creation.
9. Name. More naming.
10. Number of nodes. By default there are three. Any fewer than three and you can have downtime during upgrades. Max of 1000 allowed here. Note that you get this number of nodes deployed PER location. 3 nodes x 3 locations = 9 nodes total.
11. Enable autoscaling. Cluster autoscaling is cool. It works on a per-node-pool basis.
12. Specify node locations. Where do you want the nodes? If you have a regional cluster, this is where you choose which AZs you want.
13. Enable auto-upgrade. It’s grayed-out below because this is automatically selected for any “release channel” clusters. GKE upgrades worker nodes automatically in that case. If you chose a static version, then you have the option of selecting auto-upgrades.
14. Enable auto-repair. If a worker node isn’t healthy, auto-repair kicks in to fix or replace the node. Like the previous configuration, this one is automatically applied for “release channel’ clusters.
15. Max surge. Surge updates is about letting you control how many nodes GKE can upgrade at a given time, and how disruptive an upgrade may be. The “max surge” configuration determines how many additional nodes GKE adds to the node pool during upgrades.
16. Max unavailable. This configuration refers to how many nodes can be simultaneously unavailable during an upgrade.
Once again, you could stop here, and build your cluster. I WANT MORE CONFIGURATION. Let’s keep going. What if I want to configure the nodes themselves? That’s the next available tab.
For node configurations, you can configure:
17. Image type. This refers to the base OS which includes Google’s container-optimized OS, Ubuntu, and Windows Server.
18. Machine family. GKE runs on virtual machines. Here is where you choose which type of underlying VM you want, including general purpose, compute-optimized, memory-optimized or GPU-based.
19. Series. Some machine families have sub-options for specific VMs.
20. Machine type. Here are the specific VM sizes you want, with combinations of CPU and memory.
21. Boot disk type. This is where you choose a standard or SSD persistent disk.
22. Boot disk size. Choose how big of a boot disk you want. Max size is 65,536 GB.
23. Enable customer-managed encryption for boot disk. You can encrypt the boot disk with your own key.
24. Local SSD disks. How many attached disks do you want? Enter here. Max of 24.
25. Enable preemptible nodes. Choose to use cheaper compute instances that only live for up to 24 hours.
26. Maximum pods per node. Limit how many pods you want on a given node, which has networking implications.
27. Network tags. This represents firewall rules applied to nodes.
Security. Let’s talk about it. You have a handful of possible configurations to secure your GKE node pools.
Node pool security configurations include:
28. Service account. By default, containers running on this VM call Google Cloud APIs using this account. You may want a unique service account, and/or least-privilege one.
29. Access scopes. Control the type of level of API access to grant the underlying VM.
30. Enable sandbox with gVisor. This isn’t enabled for the default node pool, but for others, you can choose the extra level of isolation for pods on the node.
31. Enable integrity monitoring. Part of the “Shielded node” functionality, this configuration lets you monitor and verify boot integrity.
32. Enable secure boot. Use this configuration setting for additional protection from boot-level and kernel-level malware.
Our last set of options for each node pool relates to metadata. Specifically:
33. Kubernetes labels. These get applied to every node in the pool and can be used with selectors to place pods.
34. Node taints. These also apply to every node in the pool and help control what gets scheduled.
35. GCE instance metadata. This attaches info to the GCE instances
That’s the end of the node pool configurations. Now we have the option of cluster-wide configurations. First up are settings based on automation.
These cluster automation configurations include:
36. Enable Maintenance Window. If you want maintenance activities to happen during certain times or days, you can set up a schedule.
37. Maintenance exclusions. Define up to three windows where updates won’t happen.
38. Enable Notifications. GKE can publish upgrade notifications to a Google Cloud Pub/Sub topic.
39. Enable Vertical Pod Autoscaling. With this configured, your cluster will rightsize CPU and memory based on usage.
40. Enable node auto-provisioning. GKE can create/manage entire node pools on your behalf versus just nodes within a pool.
41. Autoscaling profile. Choose when to remove underutilized nodes.
The next set of cluster-level options refer to Networking. Those configurations include:
42. Network. Choose the network the GKE cluster is a member of.
43. Node subnet. Apply a subnet.
44. Public cluster / Private cluster. If you want only private IPs for your cluster, choose a private cluster.
45. Enable VPC-native traffic routing. Applies alias IP for more secure integration with Google Cloud services.
46. Automatically create secondary ranges. Disabled here because my chosen subnet doesn’t have available user-managed secondary ranges. If it did, I’d have a choice of letting GKE manage those ranges.
47. Port address range. Pods in the clusters are assigned IPs from this range.
48. Maximum pods per node. Has network implications.
49. Service address range. Any cluster services will be assigned an IP address from this range.
50. Enable intranode visibility. Pod-to-pod traffic because visible to the GCP networking fabric so that you could do flow logging, and more.
51. Enable NodeLocal DNSCache. Improve perf by running a DNS caching agent on nodes.
52. Enable HTTP load balancing. This installs a controller that applies configs to the Google Cloud Load Balancer.
53. Enable subsetting for L4 internal load balancers. Internal LBs use a subset of nodes as backends to improve perf.
54. Enable control plane authorized networks. Block untrusted, non-GCP sources from accessing the Kubernetes master.
55. Enable Kubernetes Network Policy. This API lets you define which pods can access each other.
GKE also offers a lot of (optional) cluster-level security options.
The cluster security configurations include:
56. Enable Binary Authorization. If you want a secure software supply chain, you might want to apply this configuration and ensure that only trusted images get deployed to GKE.
57. Enable Shielded GKE Nodes. This provides cryptographic identity for nodes joining a cluster.
58. Enable Confidential GKE Nodes. Encrypt the memory of your running nodes.
59. Enable Application-level Secrets Encryption. Protect secrets in etcd using a key stored in Cloud KMS.
60. Enable Workload Identity. Map Kubernetes service accounts to IAM accounts so that your workload doesn’t need to store creds. I wrote about it recently.
61. Enable Google Groups for RBAC. Grant roles to members of a Workspace group.
62. Enable legacy authorization. Prevents full Kubernetes RBAC from being used in cluster.
63. Enable basic authentication. This is a deprecated way to authenticate to a cluster. Don’t use it.
64. Issue a client certificate. Skip this too. This creates a specific cert for cluster access, and doesn’t automatically rotate.
It’s useful to have cluster metadata so that you can tag clusters by environment, and more.
The couple of metadata configurations are:
65. Description. Free text box to describe your cluster.
66. Labels. Add individual labels that can help you categorize.
We made it to the end! The last set of GKE configurations relate to features that you want to add to the cluster.
These feature-based configurations include:
67. Enable Cloud Run for Anthos. Throw Knative into your GKE cluster.
68. Enable Cloud Operations for GKE. A no-brainer. Send logs and metrics to the Cloud Ops service in Google Cloud.
69. Select logging and monitoring type. If you select #68, you can choose the level of logging (e.g. workload logging, system logging).
70. Enable Cloud TPU. Great for ML use cases within the cluster.
71. Enable Kubernetes alpha features in this cluster. Enabled if you are NOT using release channels. These are short lived clusters with everything new lit up.
72. Enable GKE usage metering. See usage broken down by namespace and label. Good for chargebacks.
73. Enable Istio. Throw Istio into your cluster. Lots of folks do it!
74. Enable Application Manager. Helps you do some GitOps style deployments.
75. Enable Compute Engine Persistent Disk CSI Driver. This is now the standard way to get volume claims for persistent storage.
76. Enable Config Connector. If you have Workload Identity enabled, you can set this configuration. It adds custom resources and controllers to your cluster that let you create and manage 60+ Google Cloud services as if they were Kubernetes resources.
FINAL TALLY. Getting started: 3 clicks. Total configurations available: 76.
Azure Kubernetes Service (AKS)
Let’s turn our attention to Microsoft Azure. They’ve had a Kubernetes service for quite a while.
When creating an AKS cluster, I’m presented with an initial set of cluster properties. Two of them (resource group, and cluster name) are required before I can “review and create” and then create the cluster. Still, it’s a simple way to get started with just five clicks.
The first tab of the provisioning experience focuses on “basic” configurations.
These configurations include:
1. Subscription. Set which of your Azure subscriptions to use for this cluster.
2. Resource group. Decide which existing (or create a new) resource group to associate with this cluster.
3. Kubernetes cluster name. Give your cluster a name.
4. Region. Choose where in the world you want you cluster.
5. Availability zones. For regions with availability zones, you can choose how to stripe the cluster across those.
6. Kubernetes version. Pick a specific version of Kubernetes for the AKS cluster.
7. Node size. Here you choose the VM family and instance type for your cluster.
8. Node count. Pick how many nodes make up the primary node pool.
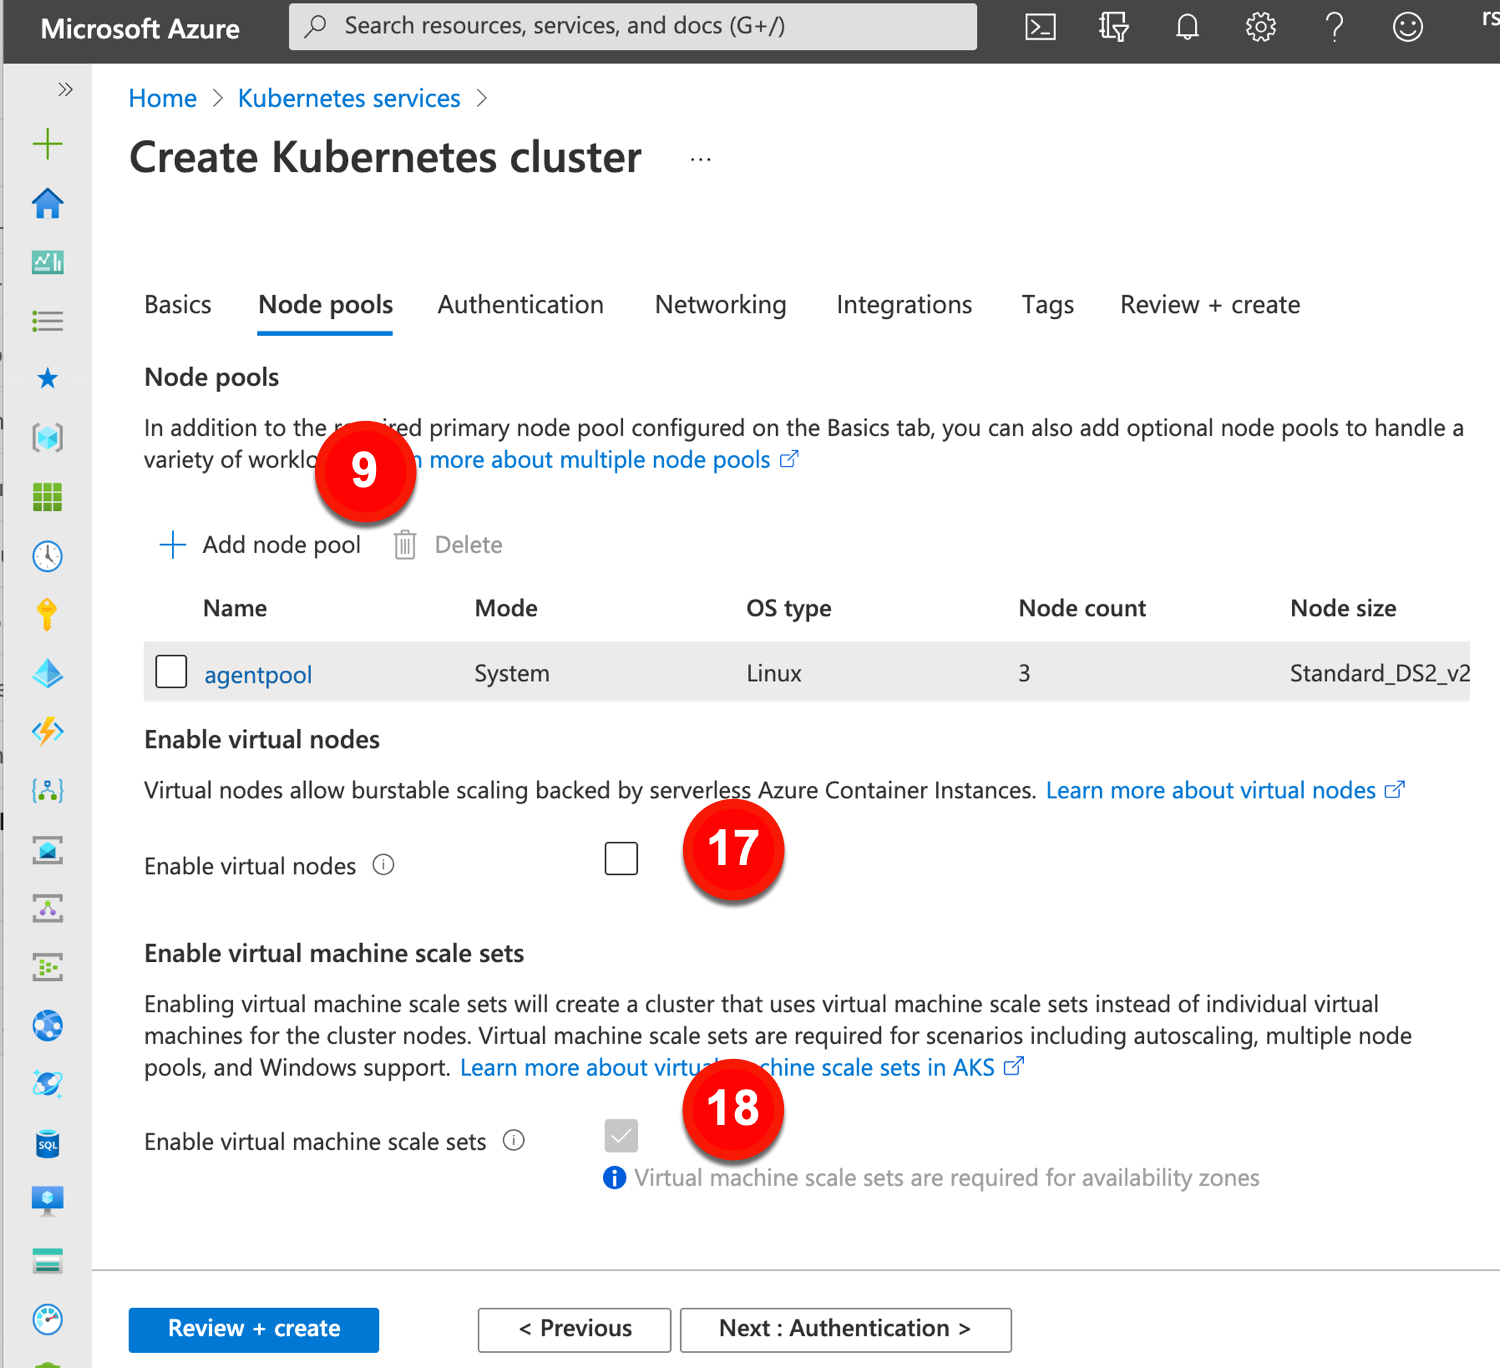
Now let’s explore the options for a given node pool. AKS offers a handful of settings, including ones that fly out into another tab. These include:
9. Add node pool. You can stick with the default node pool, or add more.
10. Node pool name. Give each node pool a unique name.
11. Mode. A “system” node pool is meant for running system pods. This is what the default node pool will always be set to. User node pools make sense for your workloads.
12. OS type. Choose Linux or Windows, although system node pools must be Linux.
13. Availability zones. Select the AZs for this particular node pool. You can change from the default set on the “basic” tab.
14. Node size. Keep or change the default VM type for the cluster.
15. Node count. Choose how many nodes to have in this pool.
16. Max pods per node. Impacts network setup (e.g. how many IP addresses are needed for each pool).
17. Enable virtual nodes. For bursty scenarios, this AKS features deploys containers to nodes backed by their “serverless” Azure Container Instances platform.
18. Enable virtual machine scale sets. Chosen by default if you use multiple AZs for a cluster. Plays a part in how AKS autoscales.
The next set of cluster-wide configurations for AKS relate to security.
These configurations include:
19. Authentication method. This determines how an AKS cluster interacts with other Azure sources like load balancers and container registries. The user has two choices here.
20. Role-based access control. This enables RBAC in the cluster.
21. AKS-managed Azure Active Directory. This configures Kubernetes RBAC using Azure AD group membership.
22. Encryption type. Cluster disks are encrypted at rest by default with Microsoft-managed keys. You can keep that setting, or change to a customer-managed key.
Now, we’ll take a gander at the network-related configurations offered by Azure. These configurations include:
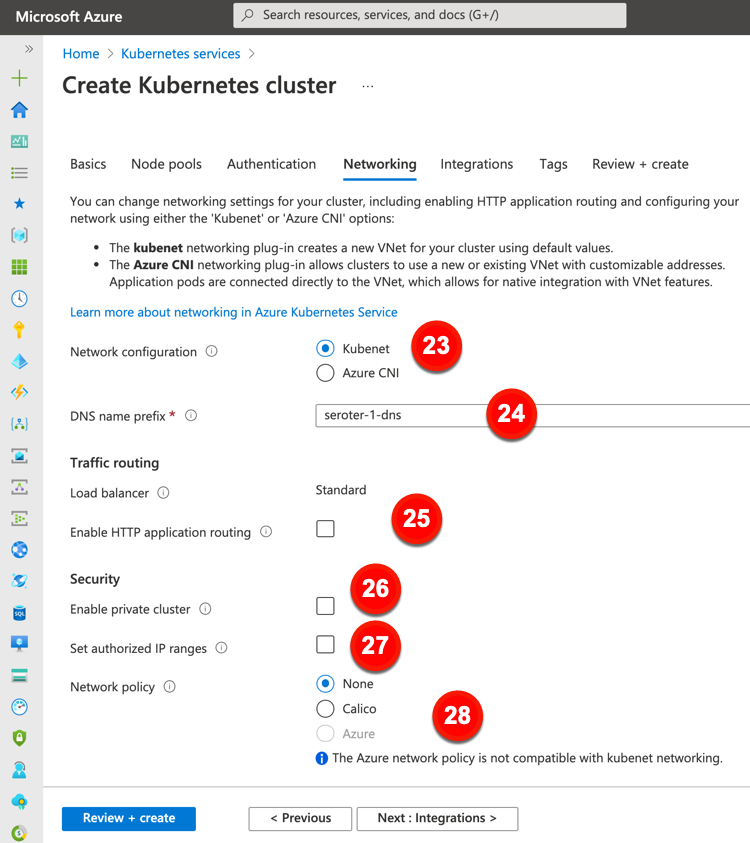
23. Network configuration. The default option here is a virtual network and subnet created for you. You can also use CNI to get a new or existing virtual network/subnet with user-defined address ranges.
24. DNS name prefix. This is the prefix used with the hosted API server’s FQDDN.
25. Enable HTTP application routing. The previous “Load balancer” configuration is fixed for every cluster created in the Azure Portal. This setting is about creating publicly accessible DNS names for app endpoints.
26. Enable private cluster. This ensures that network traffic between the API server and node pools remains on a private network.
27. Set authorized IP ranges. Choose the IP ranges that can access the API server.
28. Network policy. Define rules for ingress and egress traffic between pods in a cluster. You can choose none, Calico, or Azure’s network policies.
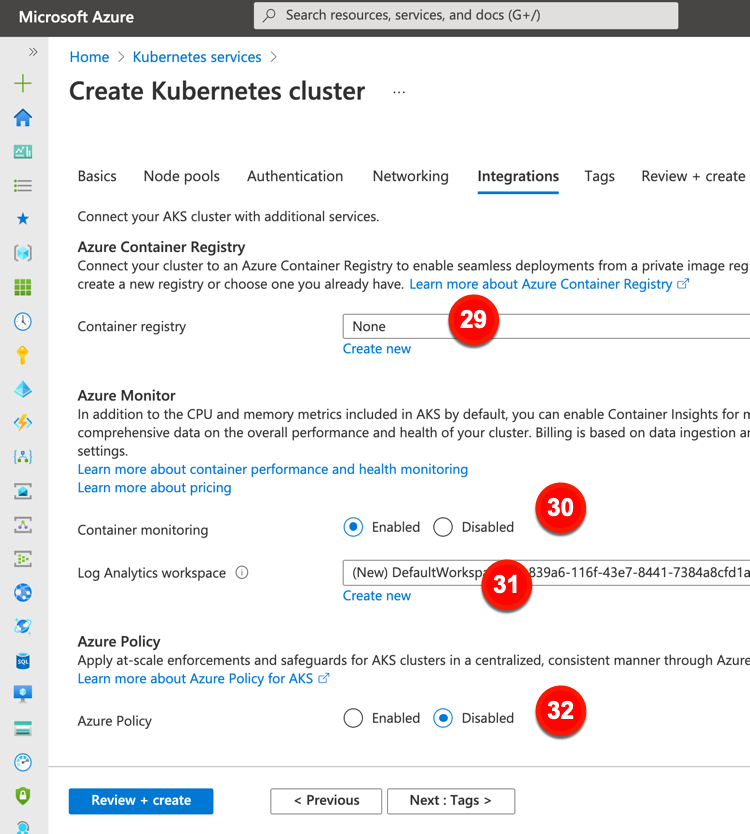
The final major configuration category is “integrations.” This offers a few options to connect AKS clusters to other Azure services.
These “integration” configurations include:
29. Container registry. Point to, or create, an Azure Container Registry instance.
30.Container monitoring. Decide whether you want workload metrics fed to Azure’s analytics suite.
31. Log Analytics workspace. Create a new one, or point to an existing one, to store monitoring data.
32. Azure Policy. Choose to apply an admission controller (via Gatekeeper) to enforce policies in the cluster.
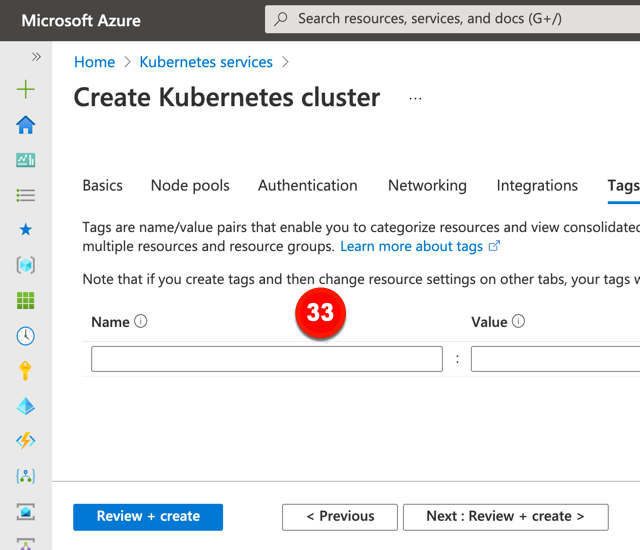
The last tab for AKS configuration relates to tagging. This can be useful for grouping and categorizing resources for chargebacks.
FINAL TALLY. Getting started: 5 clicks. Total configurations available: 33.
Amazon Elastic Kubernetes Service (EKS)
AWS is a go-to for many folks running Kubernetes, and they shipped a managed service for Kubernetes a few years back. EKS looks different from GKE or AKS. The provisioning experience is fairly simplistic, and doesn’t provision the worker nodes. That’s something you do yourself later, and then you see a series of configurations for node pools after you provision them. It also offers post-provisioning options for installing things like autoscalers, versus making that part of the provisioning.
Getting started with EKS means entering some basic info about your Kubernetes cluster.
These configurations include:
1. Name. Provide a unique name for your cluster.
2. Kubernetes version. Pick a specific version of Kubernetes for your cluster.
3. Cluster Service Role. This is the AWS IAM role that lets the Kubernetes control plan manage related resources (e.g. load balancers).
4. Secrets encryption. This gives you a way to encrypt the secrets in the cluster.
5. Tags. Add up to 50 tags for the cluster.
After these basic settings, we click through some networking settings for the cluster. Note that EKS doesn’t provision the node pools (workers) themselves, so all these settings are cluster related.
The networking configurations include:
6. Select VPC. Choose which VPC to use for the cluster. This is not optional.
7. Select subnets. Choose the VPC subnet for your cluster. Also, not optional.
8. Security groups. Choose one or more security groups that apply to worker node subnets.
9. Configure Kubernetes Service IP address range. Set the range that cluster services use for IPv4 addresses.
10. Cluster endpoint access. Decide if you want a public cluster endpoint accessible outside the VPC (including worker access), a mix of public and private, or private only.
11. Advanced settings. Here’s where you set source IPs for the public access endpoint.
12. Amazon VPC CNI version. Choose which version of the add-on you want for CNI.
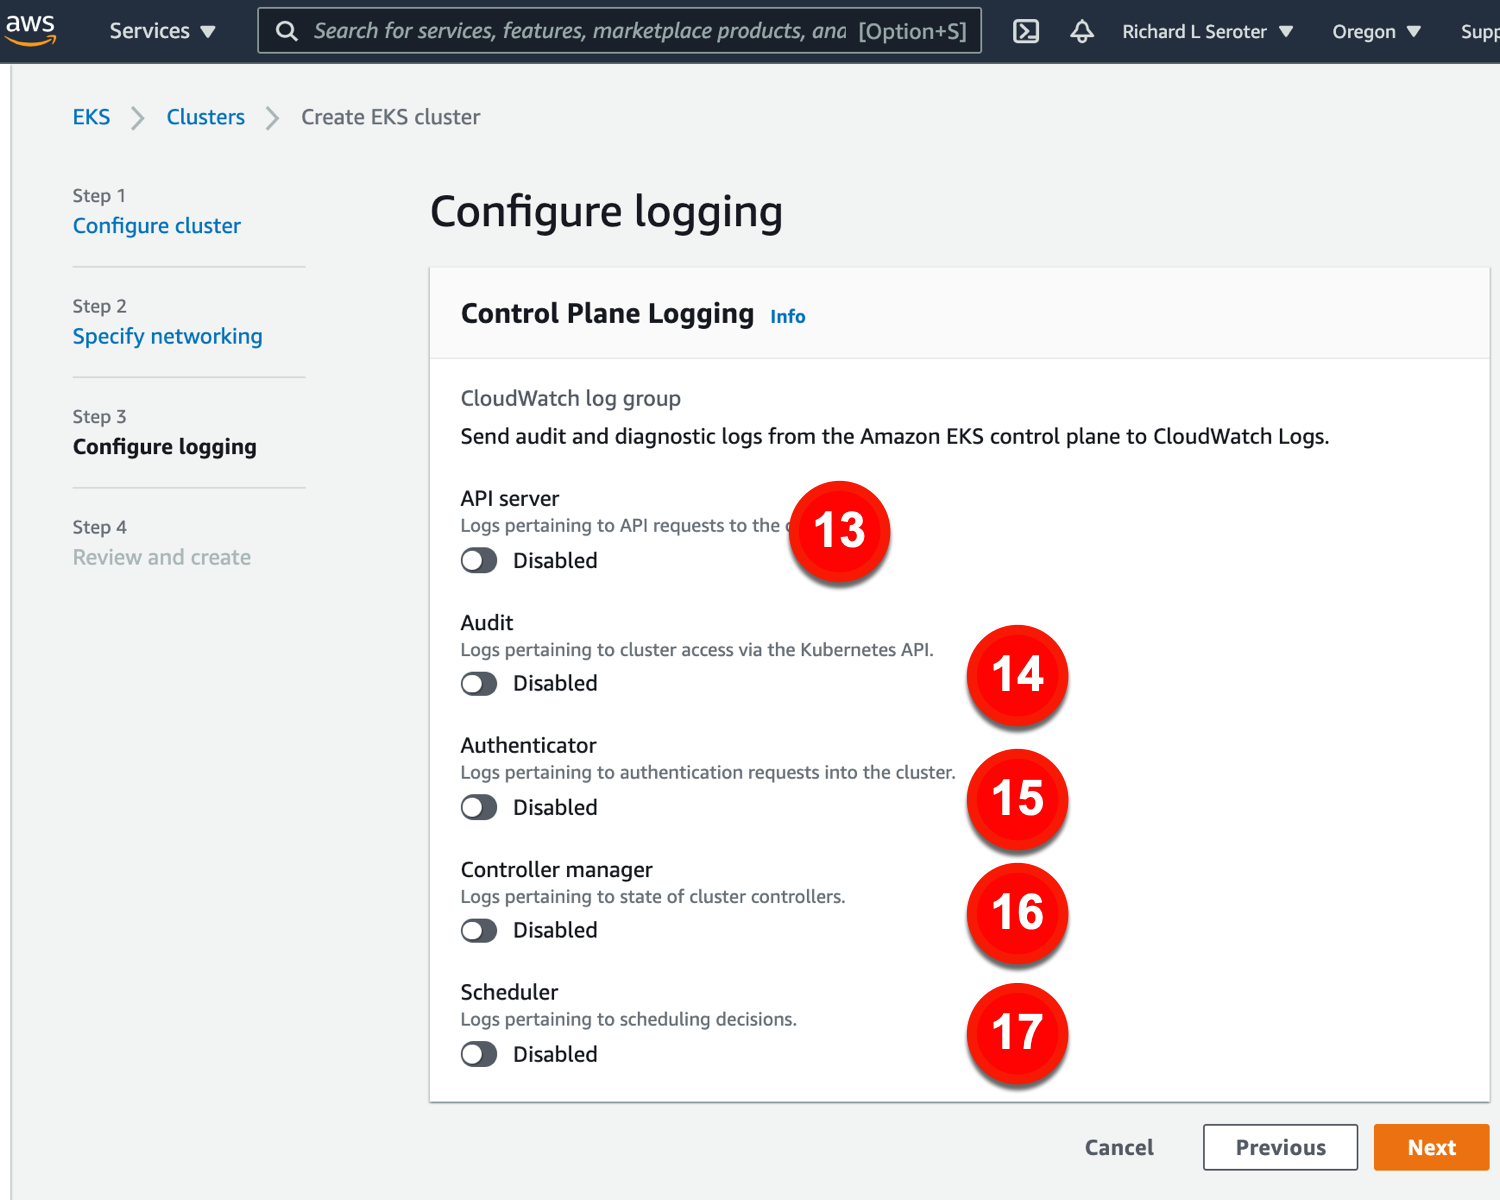
The last major configuration view for provisioning a cluster relates to logging.
The logging configurations include:
13. API server. Log info for API requests.
14. Audit. Grab logs about cluster access.
15. Authenticator. Get lots for authentication requests.
16. Controller manager. Store logs for cluster controllers.
17. Scheduler. Get logs for scheduling decisions.
We have 17 configurations available in the provisioning experience. I really wanted to stop here (versus being forced to create and pay for a cluster to access the other configuration settings), but to be fair, let’s look at post-provisioning configurations of EKS, too.
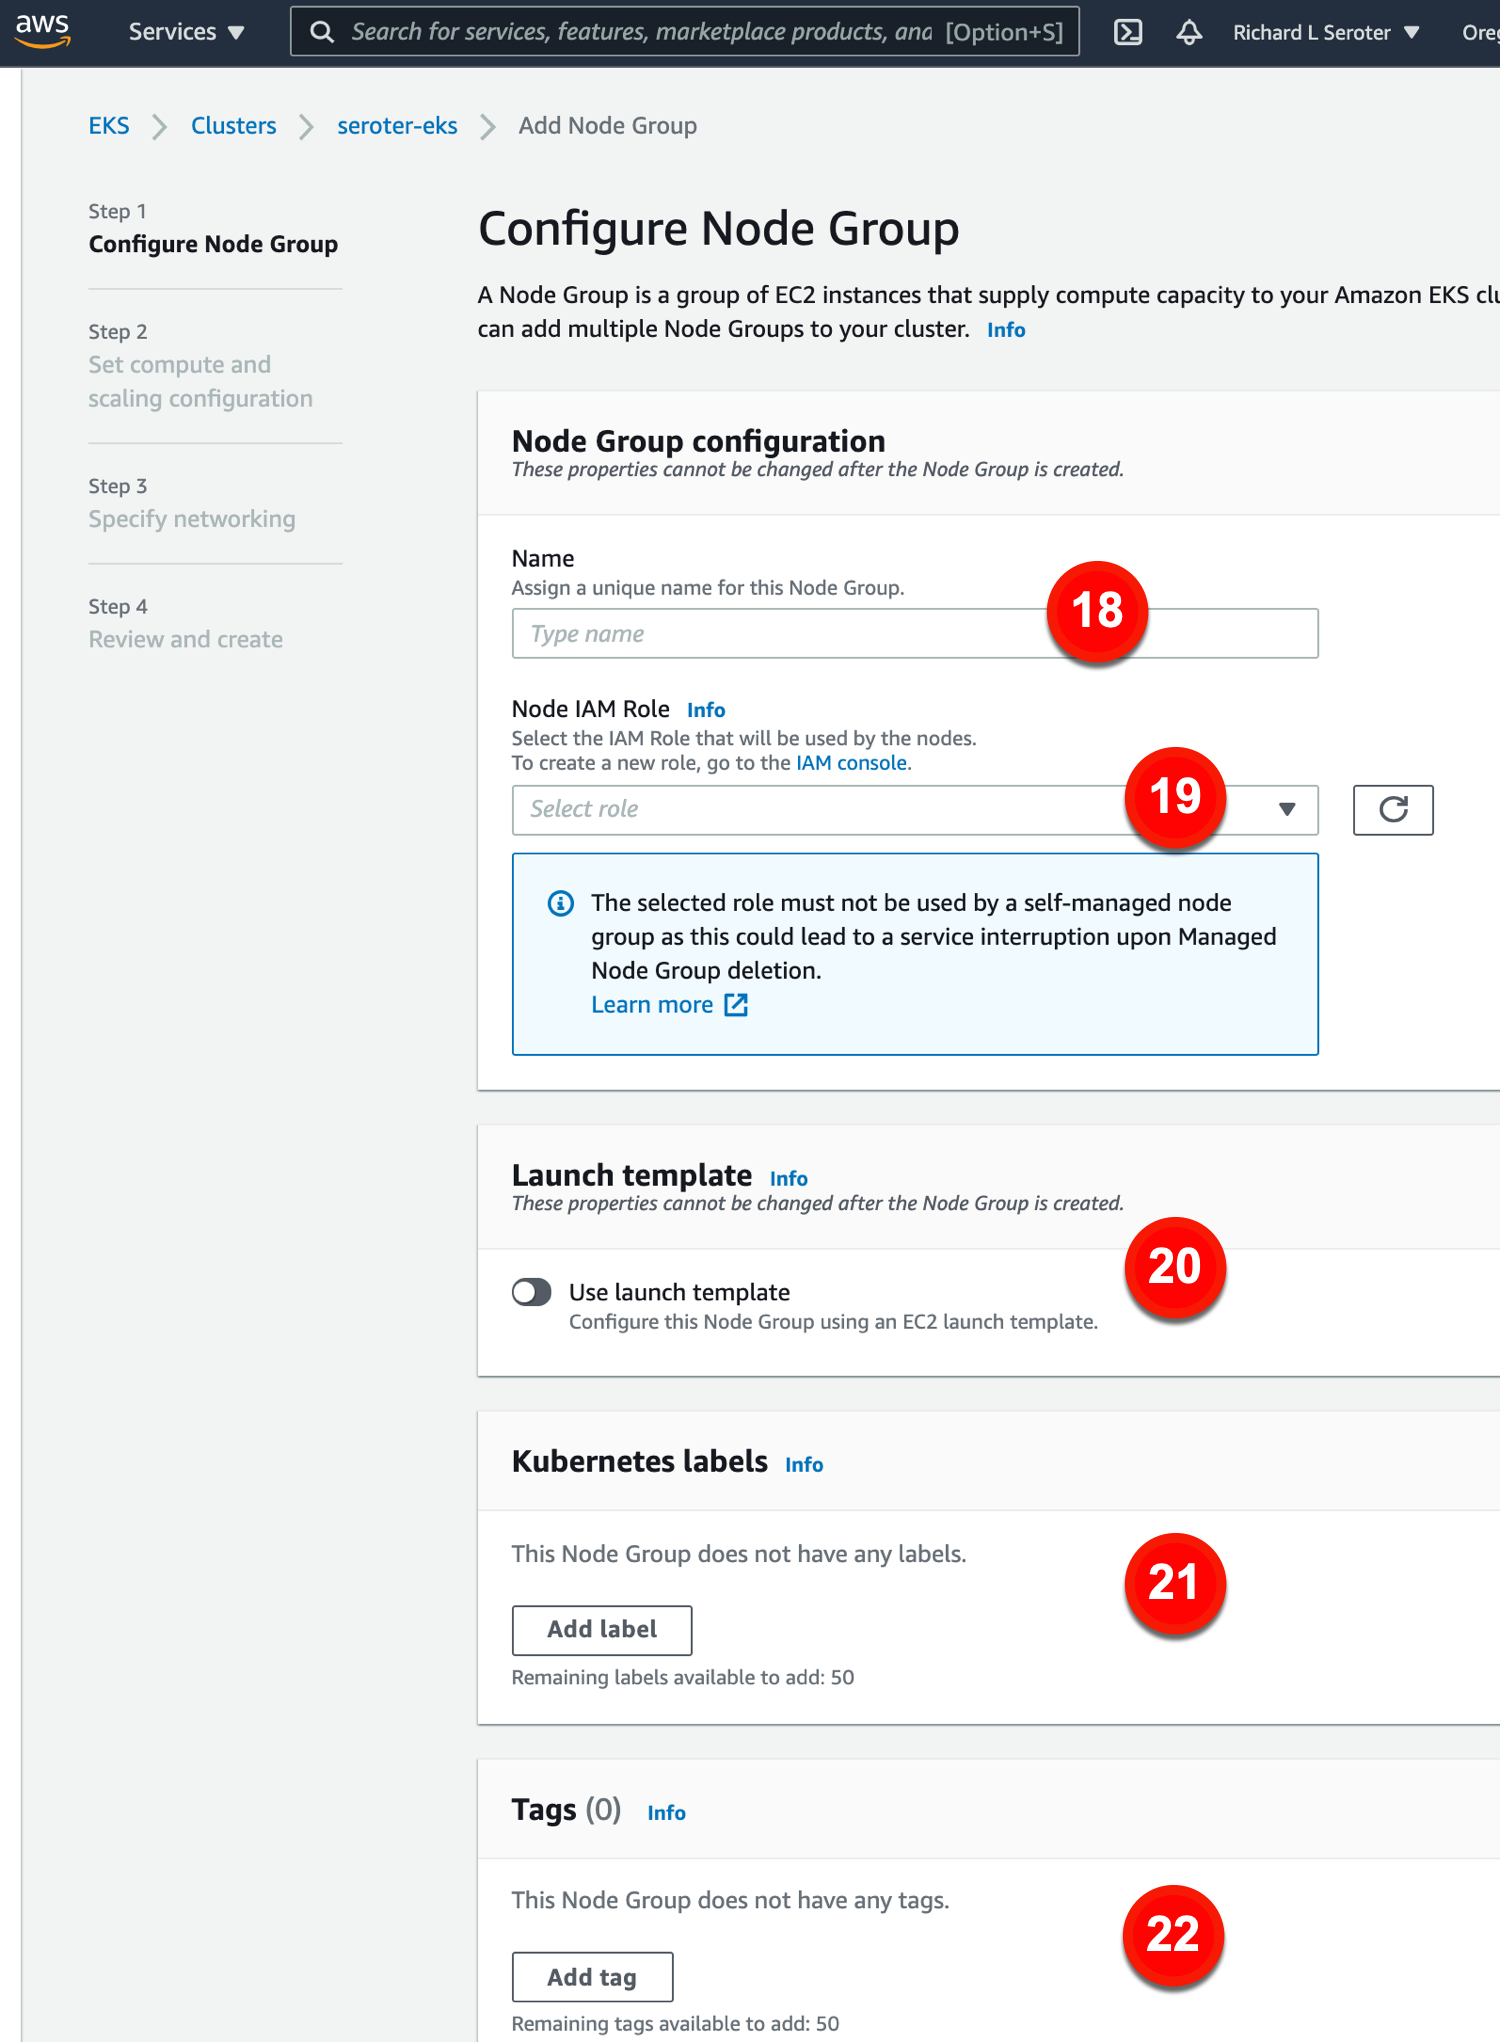
After creating an EKS cluster, we see that new configurations become available. Specifically, configurations for a given node pool.
The node group configurations include:
18. Name. This is the name for the node group.
19. Node IAM role. This is the role used by the nodes to access AWS services. If you don’t have a valid role, you need to create one here.
20. Use launch template. If you want a specific launch template, you can choose that here.
21. Kubernetes labels. Apply labels to the node group.
22. Tags. Add AWS tags to the node group.
Next we set up compute and scaling configs. These configs include:
23. AMI type. Pick the machine image you want for your nodes.
24. Capacity type. Choose on-demand or spot instances.
25. Instance type. Choose among dozens of VM instance types to host the nodes.
26. Disk size. Pick the size of attached EBS volumes.
27. Minimum size. Set the smallest size a cluster can be.
28. Maximum size. Set the largest size a cluster can be.
29. Desired size. Set the desired number of nodes to start with.
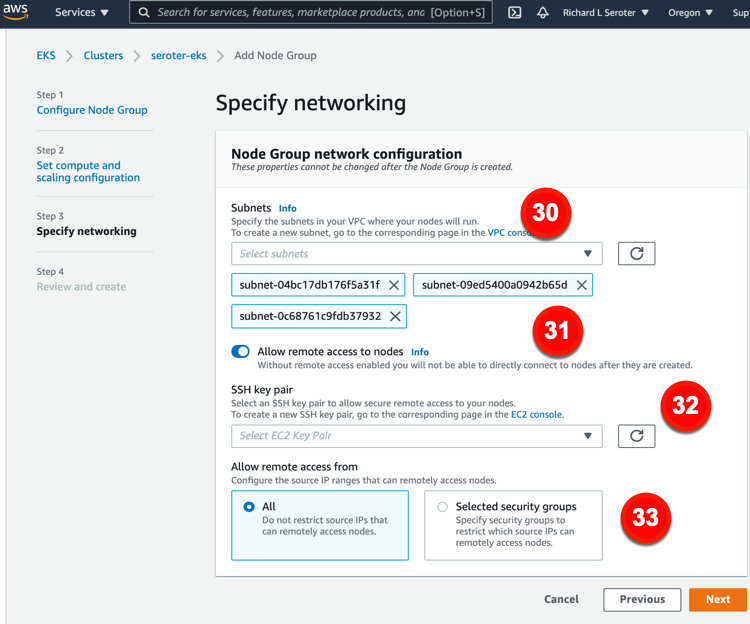
Our final set of node group settings relate to networking. The configurations you have access to here include:
30. Subnets. Choose which subnets for your nodes.
31. Allow remote access to nodes. This ensures you can access nodes after creation.
32. SSH keypair. Choose (or create) a key pair for remote access to nodes.
33. Allow remote access from. This lets you restrict access to source IP ranges.
FINAL TALLY. Getting started: 7 clicks (just cluster control plane, not nodes). Total configurations available: 33.
Wrap Up
GKE does indeed stand out here. GKE has fewest steps required to get a cluster up and running. If I want a full suite of configuration options, GKE has the most. If I want a fully managed cluster without any day-2 activities, GKE is the only one that has that, via GKE Autopilot.
Does it matter that GKE is the most configurable Kubernetes service in the public cloud? I think it does. Both AKS and EKS have a fine set of configurations. But comparing AKS or EKS to GKE, it’s clear how much more control GKE offers for cluster sizing, scaling, security, and automation. While I might not set most of these configurations on a regular basis, I can shape the platform to a wide variety of workloads and use cases when I need to. That ensures that Kubernetes can run a wide variety of things, and I’m not stuck using specialized platforms for each workload.
As you look to bring your Kubernetes platform to the cloud, keep an eye on the quality attributes you need, and who can satisfy them the best!
Real developers use the CLI, or so I’m told. That probably explains why I mostly use the portal experiences of the major cloud providers. But judging from the portal experiences offered by most clouds, they prefer you use the CLI too. So let’s look at the CLIs.
Specifically, I evaluated the cloud CLIs with an eye on five different areas:
API surface and patterns. How much of the cloud was exposed via CLI, and is there a consistent way to interact with each service?
Authentication. How do users identify themselves to the CLI, and can you maintain different user profiles?
Creating and viewing services. What does it feel like to provision instances, and then browse those provisioned instances?
CLI sweeteners. Are there things the CLI offers to make using it more delightful?
Utilities. Does the CLI offer additional tooling that helps developers build or test their software?
Let’s dig in.
Disclaimer: I work for Google Cloud, so obviously I’ll have some biases. That said, I’ve used AWS for over a decade, was an Azure MVP for years, and can be mostly fair when comparing products and services. Please call out any mistakes I make!
AWS
You have a few ways to install the AWS CLI. You can use a Docker image, or install directly on your machine. If you’re installing directly, you can download from AWS, or use your favorite package manager. AWS warns you that third party repos may not be up to date. I went ahead and installed the CLI on my Mac using Homebrew.
API surface and patterns
As you’d expect, the AWS CLI has wide coverage. Really wide. I think there’s an API in there to retrieve the name of Andy Jassy’s favorite jungle cat. The EC2 commands alone could fill a book. The documentation is comprehensive, with detailed summaries of parameters, and example invocations.
The command patterns are relatively consistent, with some disparities between older services and newer ones. Most service commands look like:
aws [service name] [action] [parameters]
Most “actions” start with create, delete, describe, get, list, or update.
S3 is one of the original AWS services, and its API is different. It uses commands like cp, ls, and rm. Some services have modify commands, others use update. For the most part, it’s intuitive, but I’d imagine most people can’t guess the commands.
The CLI supports “profiles” which seems important when you may have different access to default values based on what you’re working on.
Creating and viewing service instances
By default, everything the CLI does occurs in the region of the active profile. You can override the default region by passing in a region flag to each command. See below that I created a new SQS queue without providing a region, and it dropped it into my default one (us-west-2). By explicitly passing in a target region, I created the second queue elsewhere.
The AWS Console shows you resources for a selected region. I don’t see obvious ways to get an all-up view. A few services, like S3, aren’t bound by region, and you see all resources at once. The CLI behaves the same. I can’t view all my SQS queues, or databases, or whatever, from around the world. I can “list” the items, region by region. Deletion behaves the same. I can’t delete the above SQS queue without providing a region flag, even though the URL is region-specific.
Overall, it’s fast and straightforward to provision, update, and list AWS services using the CLI. Just keep the region-by-region perspective in mind!
CLI sweeteners
The AWS CLI gives you control over the output format. I set the default for my profile to json, but you can also do yaml, text, and table. You can toggle this on a request by request basis.
You can also take advantage of command completion. This is handy, given how tricky it may be to guess the exact syntax of a command. Similarly, I really like you can be prompted for parameters. Instead of guessing, or creating giant strings, you can go parameter by parameter in a guided manner.
The AWS CLI also offers select opportunities to interact with the resources themselves. I can send and receive SQS messages. Or put an item directly into a DynamoDB table. There are a handful of services that let you create/update/delete data in the resource, but many are focused solely on the lifecycle of the resource itself.
Finally, I don’t see a way to self-update from within the CLI itself. It looks like you rely on your package manager or re-download to refresh it. If I’m wrong, tell me!
Utilities
It doesn’t look like the CLI ships with other tools that developers might use to build apps for AWS.
Microsoft Azure
The Microsoft Azure CLI also has broad coverage and is well documented. There’s no shortage of examples, and it clearly explains how to use each command.
az [service name] [object] create | list | delete | update [parameters]
Let’s look at a few examples:
az ad app create --display-name my-ad-app
az cosmosdb list --resource-group group1
az postgres db show --name mydb --resource-group group1 --server-name myserver
az service bus queue delete --name myqueue --namespace-name mynamespace --resource-group group1
I haven’t observed much inconsistency in the CLI commands. They all seem to follow the same basic patterns.
Authentication
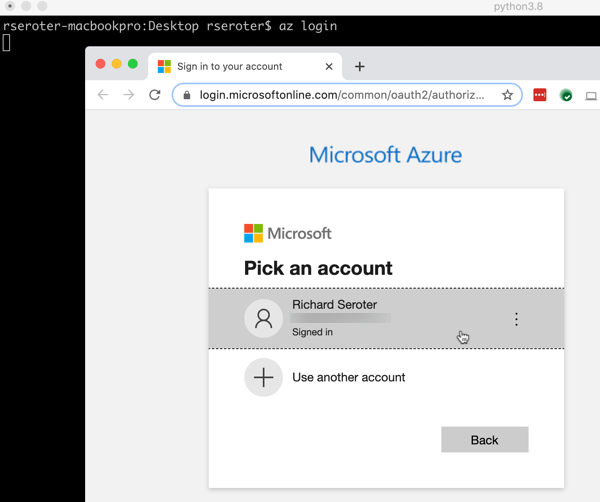
Logging into the CLI is easy. You can simply do az login as I did below—this opens a browser window and has you sign into your Azure account to retrieve a token—or you can pass in credentials. Those credentials may be a username/password, service principal with a secret, or service principal with a client certificate.
Once you log in, you see all your Azure subscriptions. You can parse the JSON to see which one is active, and will be used as the default. If you wish to change the default, you can use az account set --subscription [name] to pick a different one.
There doesn’t appear to be a way to create different local profiles.
Creating and viewing service instances
It seems that most everything you create in Azure goes into a resource group. While a resource group has a “location” property, that’s related to the metadata, not a restriction on what gets deployed into it. You can set a default resource group (az configure --defaults group=[name]) or provide the relevant input parameter on each request.
Unlike other clouds, Azure has a lot of nesting. You have a root account, then a subscription, and then a resource group. And most resources also have parent-child relationships you must define before you can actually build the thing you want.
For example, if you want a service bus queue, you first create a namespace. You can’t create both at the same time. It’s two calls. Want a storage blob to upload videos into? Create a storage account first. A web application to run your .NET app? Provision a plan. Serverless function? Create a plan. This doesn’t apply to everything, but just be aware that there are often multiple steps involved.
The creation activity itself is fairly simple. Here are commands to create Service Bus namespace and then a queue
az servicebus namespace create --resource-group mydemos --name seroter-demos --location westus
az servicebus queue create --resource-group mydemos --namespace-name seroter-demos --name myqueue
Like with AWS, some Azure assets get grouped by region. With Service Bus, namespaces are associated to a geo. I don’t see a way to query all queues, regardless of region. But for the many that aren’t, you get a view of all resources across the globe. After I created a couple Redis caches in my resource group, a simple az redis list --resource-group mydemos showed me caches in two different parts of the US.
Depending on how you use resource groups—maybe per app or per project, or even by team—just be aware that the CLI doesn’t retrieve results across resource groups. I’m not sure the best strategy for viewing subscription-wide resources other than the Azure Portal.
CLI sweeteners
The Azure CLI has some handy things to make it easier to use.
There’s a find function for figuring out commands. There’s output formatting to json, tables, or yaml. You’ll also find a useful interactive mode to get auto-completion, command examples, and more. Finally, I like that the Azure CLI supports self-upgrade. Why leave the CLI if you don’t have to?
Utilities
I noticed a few things in this CLI that help developers. First, there’s an az rest command that lets you call Azure service endpoints with authentication headers taken care of for you. That’s a useful tool for calling secured endpoints.
Azure offers a wide array of extensions to the CLI. These aren’t shipped as part of the CLI itself, but you can easily bolt them on. And you can create your own. This is a fluid list, but az extension list-available shows you what’s in the pool right now. As of this writing, there are extensions for preview AKS capabilities, managing Azure DevOps, working with DataBricks, using Azure LogicApps, querying the Azure Resource Graph, and more.
Google Cloud Platform
I’ve only recently started seriously using the GCP CLI. What’s struck me most about the gcloud tool is that it feels more like a system—dare I say, platform—than just a CLI. We’ll talk more about that in a bit.
Like with other clouds, you can use the SDK/CLI within a supported Docker image, package manager, or direct download. I did a direct download, since this is also a self-updating CLI, so I didn’t want to create a zombie scenario with my package manager.
API surface and patterns
The gcloud CLI has great coverage for the full breadth of GCP. I can’t see any missing services, including things launched two weeks ago. There is a subset of services/commands available in the alpha or beta channels, and are fully integrated into the experience. Each command is well documented, with descriptions of parameters, and example calls.
All the GCP services I’ve come across follow the same patterns. It’s also logical enough that I even guessed a few without looking anything up.
Authentication
A gcloud auth logincommand triggers a web-based authorization flow.
Once I’m authenticated, I set up a profile. It’s possible to start with this process, and it triggers the authorization flow. Invoking the gcloud init command lets me create a new profile/configuration, or update an existing one. A profile includes things like which account you’re using, the “project” (top level wrapper beneath an account) you’re using, and a default region to work in. It’s a guided processes in the CLI, which is nice.
And it’s a small thing, but I like that when it asks me for a default region, it actually SHOWS ME ALL THE REGION CODES. For the other clouds, I end up jumping back to their portals or docs to see the available values.
Creating and viewing service instances
As mentioned above, everything in GCP goes into Projects. There’s no regional affinity to projects. They’re used for billing purposes and managing permissions. This is also the scope for most CLI commands.
Provisioning resources is straightforward. There isn’t the nesting you find in Azure, so you can get to the point a little faster. For instance, provisioning a new PubSub topic looks like this:
gcloud pubsub topics create richard-topic
It’s quick and painless. PubSub doesn’t have regional homing—it’s a global service, like others in GCP—so let’s see what happens if I create something more geo-aware. I created two Spanner instances, each in different regions.
It takes seconds to provision, and then querying with gcloud spanner instances list gives me all Spanner database instances, regardless of region. And I can use a handy “filter” parameter on any command to winnow down the results.
The default CLI commands don’t pull resources from across projects, but there is a new command that does enable searching across projects and organizations (if you have permission). Also note that Cloud Storage (gsutil) and Big Query (bq) use separate CLIs that aren’t part of gcloud directly.
CLI sweeteners
I used one of the “sweeteners” before: filter. It uses a simple expression language to return a subset of results. You’ll find other useful flags for sorting and limiting results. Like with other cloud CLIs, gcloud lets you return results as json, table, csv, yaml, and other formats.
There’s also a full interactive shell with suggestions, auto-completion, and more. That’s useful as you’re learning the CLI.
gcloud has a lot of commands for interacting with the services themselves. You can publish to a PubSub topic, execute a SQL statement against a Spanner database, or deploy and call a serverless Function. It doesn’t apply everywhere, but I like that it’s there for many services.
The GCP CLI also self-updates. We’ll talk about it more in the section below.
Utilities
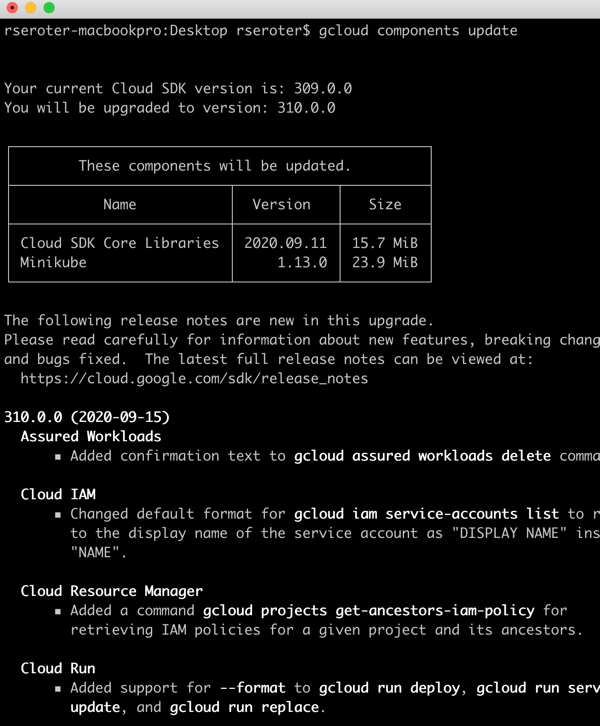
A few paragraphs ago, I said that the gcloud CLI felt more like a system. I say that, because it brings a lot of components with it. When I type in gcloud components list, I see all the options:
We’ve got the core SDK and other GCP CLIs for Big Query, but also a potpourri of other handy tools. You’ve got Kubernetes development tools like minikube, Skaffold, Kind, kpt, and kubectl. And you get a stash of local emulators for cloud services like Bigtable, Firestore, Spanner, PubSub and Spanner.
I can install any or all of these, and upgrade them all from here. A gcloud components update command update all of them, and, shows me a nice change log.
There are other smaller utility functions included in gcloud. I like that I have commands to configure Docker to work with Google Container Registry, Or fetch Kubernetes cluster credentials and put them into my active profile. And print my identity token to inject into the auth headers of calls to secure endpoints.
Wrap
To some extent, each CLI reflects the ethos of their cloud. The AWS CLI is dense, powerful, and occasionally inconsistent. The Azure CLI is rich, easy to get started with, and 15% more complicated than it should be. And the Google Cloud CLI is clean, integrated, and evolving. All of these are great. You should use them and explore their mystery and wonder.
I feel silly admitting that I barely understand what happens in the climactic scene of the 80s movie Trading Places. It has something to do with short-selling commodities—in this case, concentrated orange juice. Let’s talk about commodities, which Investopedia defines as:
a basic good used in commerce that is interchangeable with other goods of the same type. Commodities are most often used as inputs in the production of other goods or services. The quality of a given commodity may differ slightly, but it is essentially uniform across producers.
Our industry has rushed to declare Kubernetes a commodity, but is it? It is now a basic good used as input to other goods and services. But is uniform across producers? It seems to me that the Kubernetes API is commoditized and consistent, but the platform experience isn’t. Your Kubernetes experience isn’t uniform across Google Kubernetes Engine (GKE), AWS Elastic Kubernetes Service (EKS), Azure Kubernetes Service (AKS), VMware PKS, Red Hat OpenShift, Minikube, and 130+ other options. No, there are real distinctions that can impact your team’s chance of success adopting it. As you’re choosing a Kubernetes product to use, pay upfront attention to provisioning, upgrades, scaling/repair, ingress, software deployment, and logging/monitoring.
I work for Google Cloud, so obviously I’ll have some biases. That said, I’ve used AWS for over a decade, was an Azure MVP for years, and can be mostly fair when comparing products and services.
1. Provisioning
Kubernetes is a complex distributed system with lots of moving parts. Multi-cluster has won out as a deployment strategy (versus one giant mega cluster segmented by namespace), which means you’ll provision Kubernetes clusters with some regularity.
What do you have to do? How long does it take? What options are available? Those answers matter!
Kubernetes offerings don’t have identical answers to these questions:
Do you want clusters in a specific geography?
Should clusters get deployed in an HA fashion across zones?
Can you build a tiny cluster (small machine, single node) and a giant cluster?
Can you specify the redundancy of the master nodes? Is there redundancy?
Do you need to choose a specific Kubernetes version?
Are worker nodes provisioned during cluster build, or do you build separately and attach to the cluster?
Will you want persistent storage for workloads?
Are there “special” computing needs, including large CPU/memory nodes, GPUs, or TPUs?
Are you running Windows containers in the cluster?
As you can imagine, since GKE is the original managed Kubernetes, there’s lots of options for you when building clusters. Or, you can do a one-click install of a “starter” cluster, which is pretty great.
2. Upgrades
You got a cluster running? Cool! Day 2 is usually where the real action’s at. Let’s talk about upgrades, which are a fact of life for clusters. What gets upgraded? Namely the version of Kubernetes, and the configuration/OS of the nodes themselves. The level of cluster management amongst the various providers is not uniform.
GKE supports automated upgrades of everything in the cluster, or you can trigger it manually. Either way, you don’t do any of the upgrade work yourself. Release channels are pretty cool, too. DigitalOcean looks somewhat similar to GKE, from an upgrade perspective. AKS offers manually triggered upgrades. AWS offers kinda automated or extremely manual (i.e. creating new node groups or using Cloud Formation), depending on whether you used managed or unmanaged worker nodes.
3. Scaling / Repairs
Given how many containers you can run on a good-sized cluster, you may not have to scale your cluster TOO often. But, you may also decide to act in a “cloudy” way, and purposely start small and scale up as needed.
Like with most any infrastructure platform, you’ll expect to scale Kubernetes environments (minus local dev environments) both vertically and horizontally. Minimally, demand that your Kubernetes provider can scale clusters via manual commands. Increasingly, auto-scaling of the cluster is table-stakes. And don’t forget scaling of the pods (workloads) themselves. You won’t find it everywhere, but GKE does support horizontal pod autoscaling and vertical pod autoscaling too.
Also, consider how your Kubernetes platform handles the act of scaling. It’s not just about scaling the nodes or pods. It’s how well the entire system swells to absorb the increasing demand. For instance, Bayer Crop Science worked with Google Cloud to run a 15,000 node cluster in GKE. For that to work, the control planes, load balancers, logging infrastructure, storage, and much more had to “just work.” Understand those points in your on-premises or cloud environment that will feel the strain.
Finally, figure out what you want to happen when something goes wrong with the cluster. Does the system detect a down worker and repair/replace it? Most Kubernetes offerings support this pretty well, but do dig into it!
4. Ingress
I’m not a networking person. I get the gist, and can do stuff, but I quickly fall into the pit of despair. Kubernetes networking is powerful, but not simple. How do containers, pods, and clusters interact? What about user traffic in and out of the cluster? We could talk about service meshes and all that fun, but let’s zero in on ingress. Ingress is about exposing “HTTP and HTTPS routes from outside the cluster to services within the cluster.” Basically, it’s a Layer 7 front door for your Kubernetes services.
If you’re using Kubernetes on-premises, you’ll have some sort of load balancer configuration setup available, maybe even to use with an ingress controller. Hopefully! In the public cloud, major providers offer up their load-balancer-as-a-service whenever you expose a service of type “LoadBalancer.” But, you get a distinct load balancer and IP for each service. When you use an ingress controller, you get a single route into the cluster (still load balanced, most likely) and the traffic is routed to the correct pod from there. Microsoft, Amazon, and Google all document their way to use ingress controllers with their managed Kubernetes.
Make sure you investigate the network integrations and automation that comes with your Kubernetes product. There are super basic configurations (that you’ll often find in local dev tools) all the way to support for Istio meshes and ingress controllers.
5. Software Deployment
How do you get software into your Kubernetes environment? This is where the commoditization of the Kubernetes API comes in handy! Many software products know how to deploy containers to a Kubernetes environment.
Two areas come to mind here. First, deploying packaged software. You can use Helm to deploy software to most any Kubernetes environment. But let’s talk about marketplaces. Some self-managed software products deliver some form of a marketplace, and a few public clouds do. AWS has the AWS Marketplace for Containers. DigitalOcean has a nice little marketplace for Kubernetes apps. In the Google Cloud Marketplace, you can filter by Kubernetes apps, and see what you can deploy on GKE, or in Anthos environments. I didn’t notice a way in the Azure marketplace to find or deploy Kubernetes-targeted software.
The second area of software deployment I think about relates to CI/CD systems for custom apps. Here, you have a choice of 3rd party best-of-breed tools, or whatever your Kubernetes provider bakes in. AWS CodePipeline or CodeDeploy can deploy apps to ECS (not EKS, it seems). Azure Pipelines looks like it deploys apps directly to AKS. Google Cloud Build makes it easy to deploy apps to GKE, App Engine, Functions, and more.
When thinking about software deployment, you could also consider the app platforms that run atop a Kubernetes foundation, like Knative and in the future, Cloud Foundry. These technologies can shield you from some of the deployment and configuration muck that’s required to build a container, deploy it, and wire it up for routing.
6. Logging/Monitoring
Finally, take a look at what you need from a logging and monitoring perspective. Most any Kubernetes system will deliver some basic metrics about resource consumption—think CPU, memory, disk usage—and maybe some Kubernetes-specific metrics. From what I can tell, the big 3 public clouds integrate their Kubernetes services with their managed monitoring solutions. For example, you get visibility into all sorts of GKE metrics when clusters are configured to use Cloud Operations.
Then there’s the question of logging. Do you need a lot of logs, or is it ok if logs rotate often? DigitalOcean rotates logs when they reach 10MB in size. What kind of logs get stored? Can you analyze logs from many clusters? As always, not every Kubernetes behaves the same!
Plenty of other factors may come into play—things like pricing model, tenancy structure, 3rd party software integration, troubleshooting tools, and support community come to mind—when choosing a Kubernetes product to use, so don’t get lulled into a false sense of commoditization!
Most apps use databases. This is not a shocking piece of information. If your app is destined to run in a public cloud, how do you work with cloud-only databases when doing local development? It seems you have two choices:
Provision and use an instance of the cloud database. If you’re going to depend on a cloud database, you can certainly use it directly during local development. Sure, there might be a little extra latency, and you’re paying per hour for that instance. But this is the most direct way to do it.
Install and use a local version of that database. Maybe your app uses a cloud DB based on installable software like Microsoft SQL Server, MongoDB, or PostgreSQL. In that case, you can run a local copy (in a container, or natively), code against it, and swap connection strings as you deploy to production. There’s some risk, as it’s not the EXACT same environment. But doable.
A variation of choice #2 is when you select a cloud database that doesn’t have an installable equivalent. Think of the cloud-native, managed databases like Amazon DynamoDB, Google Cloud Spanner, and Azure Cosmos DB. What do you do then? Must you choose option #1 and work directly in the cloud? Fortunately, each of those cloud databases now has a local emulator. This isn’t a full-blown instance of that database, but a solid mock that’s suitable for development. In this post, I’ll take a quick look at the above mentioned emulators, and what you should know about them.
#1 Amazon DynamoDB
Amazon’s DynamoDB is a high-performing NoSQL (key-value and document) database. It’s a full-featured managed service that transparently scales to meet demand, supports ACID transactions, and offers multiple replication options.
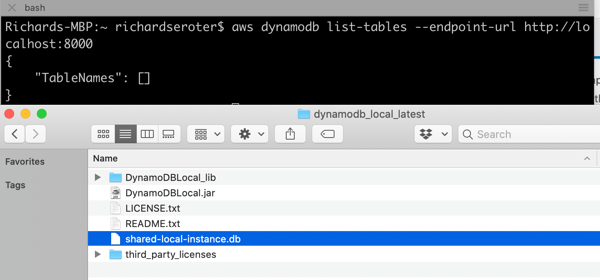
DynamoDB Local is an emulator you can run anywhere. AWS offers a few ways to run it, including a direct download—it requires Java to run—or a Docker image. I chose the downloadable option and unpacked the zip file on my machine.
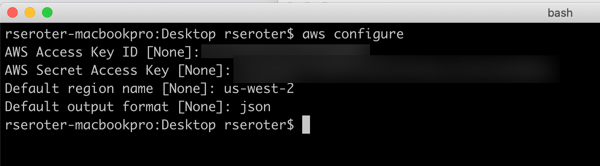
Before you can use it, you need credentials set up locally. Note that ANY credentials will do (they don’t have to be valid) for it to work. If you have the AWS CLI, you can simply do an aws configure command to generate a credentials file based on your AWS account.
The JAR file hosting the emulator has a few flags you can choose at startup:
You can see that you have a choice of running this entirely in-memory, or use the default behavior which saves your database to disk. The in-memory option is nice for quick testing, or running smoke tests in an automated pipeline. I started up DynamoDB Local with the following command, which gave me a shared database file that every local app will connect to:
This gave me a reachable instance on port 8000. Upon first starting it up, there’s no database file on disk. As soon as I issued a database query (in another console, as the emulator blocks after it starts up), I saw the database file.
Let’s try using it from code. I created a new Node Express app, and added an npm reference to the AWS SDK for JavaScript. In this app, I want to create a table in DynamoDB, add a record, and then query that record. Here’s the complete code:
const express = require('express')
const app = express()
const port = 3000

var AWS = require("aws-sdk");

//region doesn't matter for the emulator
AWS.config.update({
  region: "us-west-2",
  endpoint: "http://localhost:8000"
});

//dynamodb variables
var dynamodb = new AWS.DynamoDB();
var docClient = new AWS.DynamoDB.DocumentClient();

//table configuration
var params = {
    TableName : "Animals",
    KeySchema: [
        { AttributeName: "animal_id", KeyType: "HASH"},  //Partition key
        { AttributeName: "species", KeyType: "RANGE" }  //Sort key
    ],
    AttributeDefinitions: [
        { AttributeName: "animal_id", AttributeType: "S" },
        { AttributeName: "species", AttributeType: "S" }
    ],
    ProvisionedThroughput: {
        ReadCapacityUnits: 10,
        WriteCapacityUnits: 10
    }
};


// default endpoint
app.get('/', function(req, res, next) {
    res.send('hello world!');
});

// create a table in DynamoDB
app.get('/createtable', function(req, res) {
    dynamodb.createTable(params, function(err, data) {
        if (err) {
            console.error("Unable to create table. Error JSON:", JSON.stringify(err, null, 2));
            res.send('failed to create table')
        } else {
            console.log("Created table. Table description JSON:", JSON.stringify(data, null, 2));
            res.send('success creating table')
        }
    });
});

//create a variable holding a new data item
var animal = {
    TableName: "Animals",
    Item: {
        animal_id: "B100",
        species: "E. lutris",
        name: "sea otter",
        legs: 4
    }
}

// add a record to DynamoDB table
app.get('/addrecord', function(req, res) {
    docClient.put(animal, function(err, data) {
        if (err) {
            console.error("Unable to add animal. Error JSON:", JSON.stringify(err, null, 2));
            res.send('failed to add animal')
        } else {
            console.log("Added animal. Item description JSON:", JSON.stringify(data, null, 2));
            res.send('success added animal')
        }
    });
});

// define what I'm looking for when querying the table
var readParams = {
    TableName: "Animals",
    Key: {
        "animal_id": "B100",
        "species": "E. lutris"
    }
};

// retrieve a record from DynamoDB table
app.get('/getrecord', function(req, res) {
    docClient.get(readParams, function(err, data) {
        if (err) {
            console.error("Unable to read animal. Error JSON:", JSON.stringify(err, null, 2));
            res.send('failed to read animal')
        } else {
            console.log("Read animal. Item description JSON:", JSON.stringify(data, null, 2));
            res.send(JSON.stringify(data, null, 2))
        }
    });
});

//start up app
app.listen(port);
It’s not great, but it works. Yes, I’m using a GET To create a record. This is a free site, so you’ll take this code AND LIKE IT.
After starting up the app, I can create a table, create a record, and find it.
Because data is persisted, I can stop the emulator, start it up later, and everything is still there. That’s handy.
As you can imagine, this emulator isn’t an EXACT clone of a global managed service. It doesn’t do anything with replication or regions. The “provisioned throughput” settings which dictate read/write performance are ignored. Table scans are done sequentially and parallel scans aren’t supported, so that’s another performance-related thing you can’t test locally. Also, read operations are all eventually consistent, but things will be so fast, it’ll seem strongly consistent. There are a few other considerations, but basically, use this to build apps, not to do performance tests or game-day chaos exercises.
#2 Google Cloud Spanner
Cloud Spanner is a relational database that Google says is “built for the cloud.” You get the relational database traits including schema-on-write, strong consistency, and ANSI SQL syntax, with some NoSQL database traits like horizontal scale and great resilience.
Just recently, Google Cloud released a beta emulator. The Cloud Spanner Emulator stores data in memory and works with their Java, Go, and C++ libraries. To run the emulator, you need Docker on your machine. From there, you can either use the gcloud CLI to run it, a pre-built Docker image, Linux binaries, and more. I’m going to use the gcloud CLI that comes with the Google Cloud SDK.
I ran a quick update of my existing SDK, and it was cool to see it pull in the new functionality. Kicking off emulation from the CLI is a developer-friendly idea.
Starting up the emulator is simple: gcloud beta emulators spanner start. The first time it runs, the CLI pulls down the Docker image, and then starts it up. Notice that it opens up all the necessary ports.
I want to make sure my app doesn’t accidentally spin up something in the public cloud, so I create a separate gcloud configuration that points at my emulator and uses the project ID of “seroter-local.”
gcloud config configurations create emulator
gcloud config set auth/disable_credentials true
gcloud config set project seroter-local
gcloud config set api_endpoint_overrides/spanner http://localhost:9020/
Next, I create a database instance. Using the CLI, I issue a command creating an instance named “spring-demo” and using the local emulator configuration.
Instead of building an app from scratch, I’m using one of the Spring examples created by the Google Cloud team. Their go-to demo for Spanner uses their library that already recognizes the emulator, if you provide a particular environment variable. This demo uses Spring Data to work with Spanner, and serves up web endpoints for interacting with the database.
In the application package, the only file I had to change was the application.properties. Here, I specified project ID, instance ID, and database to create.
In the terminal window where I’m going to run the app, I set two environment variables. First, I set SPANNER_EMULATOR_HOST=localhost:9010. As I mentioned earlier, the Spanner library for Java looks for this value and knows to connect locally. Secondly, I set a pointer to my GCP service account credentials JSON file: GOOGLE_APPLICATION_CREDENTIALS=~/Downloads/gcp-key.json. You’re not supposed to need creds for local testing, but my app wouldn’t start without it.
Finally, I compile and start up the app. There are a couple ways this app lets you interact with Spanner, and I chose the “repository” one:
After a second or two, I see that the app compiled, and data got loaded into the database.
Pinging the endpoint in the browser gives a RESTful response.
Like with the AWS emulator, the Google Cloud Spanner emulator doesn’t do everything that its managed counterpart does. It uses unencrypted traffic, identity management APIs aren’t supported, concurrent read/write transactions get aborted, there’s no data persistence, quotas aren’t enforced, and monitoring isn’t enabled. There are also limitations during the beta phase, related to the breadth of supported queries and partition operations. Check the GitHub README for a full list.
#3 Microsoft Azure Cosmos DB
Now let’s look at Azure’s Cosmos DB. This is billed as a “planet scale” NoSQL database with easy scaling, multi-master replication, sophisticated transaction support, and support for multiple APIs. It can “talk” Cassandra, MongoDB, SQL, Gremlin, or Etcd thanks to wire-compatible APIs.
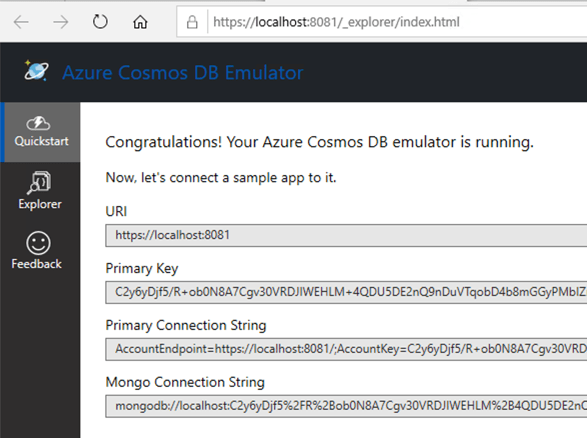
Microsoft offers the Azure Cosmos Emulator for local development. Somewhat inexplicably, it’s available only as a Windows download or Windows container. That surprised me, given the recent friendliness to Mac and Linux. Regardless, I spun up a Windows 10 environment in Azure, and chose the downloadable option.
Once it’s installed, I see a graphical experience that closely resembles the one in the Azure Portal.
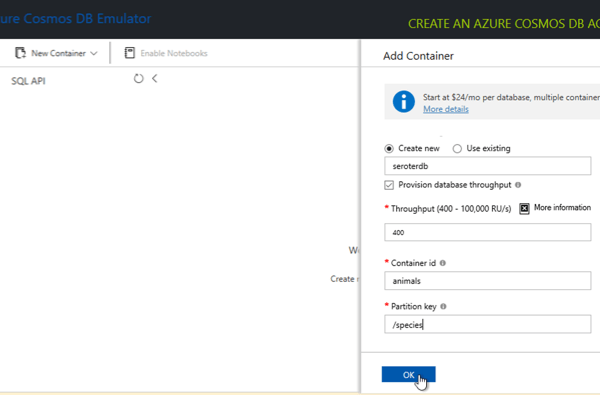
From here, I use this graphical UI and build out a new database, container—not an OS container, but the name of a collection—and specify a partition key.
For fun, I added an initial database record to get things going.
Nice. Now I have a database ready to use from code. I’m going to use the same Node.js app I built for the AWS demo above, but this time, reference the Azure SDK (npm install @azure/cosmos) to talk to the database. I also created a config.json file that stores, well, config values. Note that there is a single fixed account and well-known key for all users. These aren’t secret.
Finally, the app code itself. It’s pretty similar to what I wrote earlier for DynamoDB. I have an endpoint to add a record, and another one to retrieve records.
When I start the app, I call the endpoint to create a record, see it show up in Cosmos DB, and issue another request to get the records that match the target “species.” Sure enough, everything works great.
What’s different about the emulator, compared to the “real” Cosmos DB? The emulator UI only supports the SQL API, not the others. You can’t use the adjustable consistency levels—like strong, session, or eventual—for queries. There are limits on how many containers you can create, and there’s no concept of replication here. Check out the remaining differences on the Azure site.
All three emulators are easy to set up and straightforward to use. None of them are suitable for performance testing or simulating production resilience scenarios. That’s ok, because the “real” thing is just a few clicks (or CLI calls) away. Use these emulators to iterate on your app locally, and maybe to simulate behaviors in your integration pipelines, and then spin up actual instances for in-depth testing before going live.
Are all serverless compute platforms—typically labeled Function-as-a-Service—the same? Sort of. They all offer scale-to-zero compute triggered by events and billed based on consumed resources. But I haven’t appreciated the nuances of these offerings, until now. Last week, Laurence Hecht did great work analyzing the latest CNCF survey data. It revealed which serverless (compute) offerings have the most usage. To be clear, this is about compute, not databases, API gateways, workflow services, queueing, or any other managed services.
Serverless usage rose from 37% in 2018 to 46% in 2019. Waiting for the 2020 study, but IMHO don't significant breadth of growth (adoption %). Instead, growth will be in terms of depth — # of workloads, # of app components. https://t.co/gjgF30YqNppic.twitter.com/Izcmcdkb7L
To me, the software in that list falls into one of three categories: connective compute, platform expanding, and full stack apps. Depending on what you want to accomplish, one may be better than the others. Let’s look at those three categories, see which platforms fall into each one, and see an example in action.
Category 1: Connective Compute
Trigger / Destination
Signature
Packaging
Deployment
Database, storage, message queue, API Gateway, CDN, Monitoring service
Handlers with specific parameters
ZIP archive, containers
Web portal, CLI, CI/CD pipelines
The best functions are small functions that fill the gaps between managed services. This category is filled with products like AWS Lambda, Microsoft Azure Functions, Google Cloud Functions, Alibaba Cloud Functions, and more. These functions are triggered when something happens in another managed service—think of database table changes, messages reaching a queue, specific log messages hitting the monitoring system, and files uploaded to storage. With this category of serveless compute, you stitch together managed services into apps, writing as little code as possible. Little-to-none of your existing codebase transfers over, as this caters to greenfield solutions based on a cloud-first approach.
AWS Lambda is the grandaddy of them all, so let’s take a look at it.
In my example, I want to read messages from a queue. Specifically, have an AWS Lambda function read from Amazon SQS. Sounds simple enough!
You can write AWS Lambda functions in many ways. You can also deploy them in many ways. There are many frameworks that try to simplify the latter, as you would rarely deploy a single function as your “app.” Rather, a function is part of a broader collection of resources that make up your system. Those resources might be described via the AWS Serverless Application Model (SAM), where you can lay out all the functions, databases, APIs and more that should get deployed together. And you could use the AWS Serverless Application Repository to browse and deploy SAM templates created by you, or others. However you define it, you’ll deploy your function-based system via the AWS CLI, AWS console, AWS-provided CI/CD tooling, or 3rd party tools like CircleCI.
For this simple demo, I’m going to build a C#-based function and deploy it via the AWS console.
First up, I went to the AWS console and defined a new queue in SQS. I chose the “standard queue” type.
Next up, creating a new AWS Lambda function. I gave it a name, chose .NET Core 3.1 as my runtime, and created a role with basic permissions.
After clicking “create function”, I get a overview screen that shows the “design” of my function and provides many configuration settings.
I clicked “add trigger” to specify what event kicks off my function. I’ve got lots of options to choose from, which is the hallmark of a “connective compute” function platform. I chose SQS, selected my previously-created queue from the dropdown list, and clicked “Add.”
Now all I have to do is the write the code that handles the queue message. I chose VS Code as my tool. At first, I tried using the AWS Toolkit for Visual Studio Code to generate a SAM-based project, but the only template was an API-based “hello world” one that forced me to retrofit a bunch of stuff after code generation. So, I decided to skip SAM for now, and code the AWS Lambda function directly, by itself.
The .NET team at AWS has done below-the-radar great work for years now, and their Lambda tooling is no exception. They offer a handful of handy templates you can use with the .NET CLI. One basic command installs them for you: dotnet new -i Amazon.Lambda.Templates
I chose to create a new project by entering dotnet new lambda.sqs. This produced a pair of projects, one with the function source code, and one that has unit tests. The primary project also has a aws-lambda-tools-default.json file that includes command line options for deploying your function. I’m not sure if I need it given I’m deploying via CLI, but I updated references to .NET Core 3.1 anyway. Note that the “function-handler” value *is* important, as we’ll need that shortly. This tells Lambda which operation (in which class) to invoke.
I kept the generated function code, which simply prints out the contents of the message pulled from Amazon SQS.
I successfully built the project, and then had to “publish” it to get the right assets for packaging. This publish command ensures that configuration files get bundled up as well:
Now, all I have to do is zip up the resulting files in the “publish” directory. With those DLLs and *.json files zipped up, I return to the AWS console to upload my code. In most cases, you’re going to stash the archive file in Amazon S3 (either manually, or as the result of a CI process). Here, I uploaded my ZIP file directly, AND, set the function handler value equal to the “function-handler” value from my configuration file.
After I click “save”, I get a notice that my function was updated. I went back to Amazon SQS, and sent a few messages to the queue, using the “send a message” option.
After a moment, I saw entries in the “monitoring” view of the AWS Lambda console, and drilled into the CloudWatch logs and saw that my function wrote out the SQS payloads.
I’m impressed at how far the AWS Lambda experience has come since I first tried it out. You’ll find similarly solid experiences from Microsoft, Google and others as you use their FaaS platforms as glue code to connect managed services.
Category 2: Platform Expanding
Trigger / Destination
Signature
Packaging
Deployment
HTTP
Handlers with specific parameters
code packages
Web portal, CLI
There’s a category of FaaS that, to me, isn’t about connecting services together, as much as it’s about expanding or enriching the capabilities of a host platform. From the list above, I’d put offerings like Cloudflare Workers, Twilio Functions, and Zeit Serverless Functions into that bucket.
Most, if not all, of these start with an HTTP request and only support specific programming languages. For Twilio, you can use their integrated FaaS to serve up tokens, call outbound APIs after receiving an SMS, or even change voice calls. Zeit is an impressive host for static sites, and their functions platform supports backend operations like authentication, form submissions, and more. And Cloudflare Workers is about adding cool functionality whenever someone sends a request to a Cloudfare-managed domain. Let’s actually mess around with Cloudflare Workers.
I go to my (free) Cloudflare account to get started. You can create these running-at-the-edge functions entirely in the browser, or via the Wrangler CLI. Notice here that Workers support JavaScript, Rust, C, and C++.
After I click “create a Worker”, I’m immediately dropped into a web console where I can author, deploy, and test my function. And, I get some sample code that represents a fully-working Worker. All workers start by responding to a “fetch” event.
I don’t think you’d use this to create generic APIs or standalone apps. No, you’d use this to make the Cloudflare experience better. They handily have a whole catalog of templates to inspire you, or do your work for you. Most of these show examples of legit Cloudflare use cases: inspect and purge sensitive data from responses, deny requests missing an authorization header, do A/B testing based on cookies, and more. I copied the code from the “redirect” template which redirects requests to a different URL. I changed a couple things, clicked “save and deploy” and called my function.
On the left is my code. In the middle is the testing console, where I submitted a GET request, and got back a “301 Moved Permanently” HTTP response. I also see a log entry from my code. If you call my function in your browser, you’ll get redirected to cloudflare.com.
That was super simple. The serverless compute products in this category have a constrained set of functionality, but I think that’s on purpose. They’re meant to expand the set of problems you can solve with their platform, versus creating standalone apps or services.
Category 3: Full Stack Apps
Trigger / Destination
Signature
Packaging
Deployment
HTTP, queue, time
None
Containers
Web portal, CLI, CI/CD pipelines
This category—which I can’t quite figure out the right label for—is about serverless computing for complete web apps. These aren’t functions, per-se, but run on a serverless stack that scales to zero and is billed based on usage. The unit of deployment is a container, which means you are providing more than code to the platform—you are also supplying a web server. This can make serverless purists squeamish since a key value prop of FaaS is the outsourcing of the server to the platform, and only focusing on your code. I get that. The downside of that pure FaaS model is that it’s an unforgiving host for any existing apps.
What fits in this category? The only obvious one to me is Google Cloud Run, but AWS Fargate kinda fits here too. Google Cloud Run is based on the popular open source Knative project, and runs as a managed service in Google Cloud. Let’s try it out.
First, install the Google Cloud SDK to get the gcloud command line tool. Once the CLI gets installed, you do a gcloud init in order to link up your Google Cloud credentials, and set some base properties.
Now, to build the app. What’s interesting here, is this is just an app. There’s no special format or method signature. The app just has to accept HTTP requests. You can write the app in any language, use any base image, and end up with a container of any size. The app should still follow some basic cloud-native patterns around fast startup and attached storage. This means—and Google promotes this—that you can migrate existing apps fairly easily. For my example, I’ll use Visual Studio for Mac to build a new ASP.NET Web API project with a couple RESTful endpoints.
The default project generates a weather-related controller, so let’s stick with that. To show that Google Cloud Run handles more than one endpoint, I’m adding a second method. This one returns a forecast for Seattle, which has been wet and cold for months.
namespace seroter_api_gcr.Controllers
{
    [ApiController]
    [Route("[controller]")]
    public class WeatherForecastController : ControllerBase
    {
        private static readonly string[] Summaries = new[]
        {
            "Freezing", "Bracing", "Chilly", "Cool", "Mild", "Warm", "Balmy", "Hot", "Sweltering", "Scorching"
        };

        private readonly ILogger<WeatherForecastController> _logger;

        public WeatherForecastController(ILogger<WeatherForecastController> logger)
        {
            _logger = logger;
        }

        [HttpGet]
        public IEnumerable<WeatherForecast> Get()
        {
            var rng = new Random();
            return Enumerable.Range(1, 5).Select(index => new WeatherForecast
            {
                Date = DateTime.Now.AddDays(index),
                TemperatureC = rng.Next(-20, 55),
                Summary = Summaries[rng.Next(Summaries.Length)]
            })
            .ToArray();
        }

        [HttpGet("seattle")]
        public WeatherForecast GetSeattleWeather()
        {
            return new WeatherForecast { Date = DateTime.Now, Summary = "Chilly", TemperatureC = 6 };
        }
    }
}
If I were doing this the right way, I’d also change my Program.cs file and read the port from a provided environment variable, as Google suggests. I’m NOT going to do that, and instead will act like I’m just shoveling an existing, unchanged API into the service.
The app is complete and works fine when running locally. To work with Google Cloud Run, my app must be containerized. You can do this a variety of ways, including the most reasonable, which involves Google Cloud Build and continuous delivery. I don’t roll like that. WE’RE DOING IT BY HAND.
I will cheat and have Visual Studio give me a valid Dockerfile. Right-click the project, and add Docker support. This creates a Docker Compose project, and throws a Dockerfile into my original project.
Let’s make one small tweak. In the Dockerfile, I’m exposing port 5000 from my container, and setting an environment variable to tell my app to listen on that port.
I opened my CLI, and navigated to the folder directly above this project. From there, I executed a Docker build command that pointed to the generated Dockerfile, and tagged the image for Google Container Registry (where Google Cloud Run looks for images).
That finished, and I had a container image in my local registry. I need to get it up to Google Container Registry, so I ran a Docker push command.
docker push gcr.io/seroter/seroter-api-gcr
After a moment, I see that container in the Google Container Registry.
Neat. All that’s left is to spin up Google Cloud Run. From the Google Cloud portal, I choose to create a new Google Cloud Run service. I choose a region and name for my service.
Next up, I chose the container image to use, and set the container port to 5000. There are lots of other settings here too. I can create a connection to managed services like Cloud SQL, choose max requests per container, set the request timeout, specify the max number of container instances, and more.
After creating the service, I only need to wait a few seconds before my app is reachable.
As expected, I can ping both API endpoints and get back a result. After a short duration, the service spins compute down to zero.
Wrap up
The landscape of serverless computing is broader than you may think. Depending on what you’re trying to do, it’s possible to make a sub-optimal choice. If you’re working with many different managed services and writing code to connect them, use the first category. If you’re enriching existing platforms with bits of compute functionality, use the second category. And if you’re migrating or modernizing existing apps, or have workloads that demand more platform flexibility, choose the third. Comments? Violent disagreement? Tell me below.
Function-as-a-service gets all the glory in the serverless world, but the eventing backplane is the unheralded star of modern architectures, serverless or otherwise. Don’t get me wrong, scale-to-zero compute is cool. But is your company really transforming because you’re using fewer VMs? I’d be surprised. No, it seems that big benefits comes from a reimagined architecture, often powered by (managed) software that emit and consume events. If you have this in place, creative developers can quickly build out systems by tapping into event streams. If you have a large organization, and business systems that many IT projects tap into, this sort of event-driven architecture can truly speed up delivery.
But I doubt that most existing software at your company is powered by triggers and events. How can you start being more event-driven with all the systems you have in place now? In this post, I’ll look at three techniques I’ve used or seen.
First up, what do you need at your disposal? What’s the critical tech if you want to event-enable your existing SaaS or on-premises software? How about:
Event bus/backbone. You need an intermediary to route events among systems. It might be on-premises or in the public cloud, in-memory or persistent, open source or commercial. The important thing is having a way to fan-out the information instead of only offering point-to-point linkages.
Connector library. How are you getting events to and from software systems? You may use HTTP APIs or some other protocol. What you want is a way to uniformly talk to most source/destination systems without having to learn the nuances of each system. A series of pre-built connectors play a big part.
Schema registry. Optional, but important. What do the events looks like? Can I discover the available events and how to tap into them?
Event-capable targets. Your downstream systems need to be able to absorb events. They might need a translation layer or buffer to do so.
MOST importantly, you need developers/architects that understand asynchronous programming, stateful stream processing, and distributed systems. Buying the technology doesn’t matter if you don’t know how to best use it.
Let’s look at how you might use these technologies and skills to event-ify your systems. In the comments, tell me what I’m missing!
Option #1: Light up natively event-driven capabilities in the software
Some software is already event-ready and waiting for you to turn it on! Congrats if you use a wide variety of SaaS systems like Salesforce (via outbound messaging), Oracle Cloud products (e.g. Commerce Cloud), GSuite (via push notifications), Office 365 (via graph API) and many more. Heck, even some cloud-based databases like Azure Cosmos DB offer a change feed you can snack on. It’s just a matter of using these things.
On-premises software can work here as well. A decade ago, I worked at Amgen and we created an architecture where SAP events were broadcasted through a broker, versus countless individual systems trying to query SAP directly. SAP natively supported eventing then, and plenty of systems do now.
For either case—SaaS systems or on-premises software—you have to decide where the events go. You can absolutely publish events to single-system web endpoints. But realistically, you want these events to go into an event backplane so that everyone (who’s allowed) can party on the event stream.
AWS has a nice offering that helps here. Amazon EventBridge came out last year with a lot of fanfare. It’s a fully managed (serverless!) service for ingesting and routing events. EventBridge takes in events from dozens of AWS services, and (as of this writing) twenty-five partners. It has a nice schema registry as well, so you can quickly understand the events you have access to. The list of integrated SaaS offerings is a little light, but getting better.
Given their long history in the app integration space, Microsoft also has a good cloud story here. Their eventing subsystem, called Azure Event Grid, ingests events from Azure (or custom) sources, and offers sophisticated routing rules. Today, its built-in event sources are all Azure services. If you’re looking to receive events from a SaaS system, you bolt on Azure Logic Apps. This service has a deep array of connectors that talk to virtually every system you can think of. Many of these connectors—including SharePoint, Salesforce, Workday, Microsoft Dynamics 365, and Smartsheet—support push-based triggers from the SaaS source. It’s fairly easy to create a Logic App that receives a trigger, and publishes to Azure Event Grid.
And you can always use “traditional” service brokers like Microsoft’s BizTalk Server which offer connectors, and pub/sub routing on any infrastructure, on-premises or off.
Option #2: Turn request-driven APIs into event streams
What if your software doesn’t have triggers or webhooks built in? That doesn’t mean you’re out of luck.
Virtually all modern packaged (on-premises or SaaS) software offers APIs. Even many custom-built apps do. These APIs are mostly request-response based (versus push-based async, or request-stream) but we can work with this.
One pattern? Have a scheduler call those request-response APIs and turn the results into broadcasted events. Is it wasteful? Yes, polling typically is. But, the wasted polling cycles are worth it if you want to create a more dynamic architecture.
Microsoft Azure users have good options. Specifically, you can quickly set up an Azure Logic App that talks to most everything, and then drops the results to Azure EventGrid for broadcast to all interested parties. Logic Apps also supports debatching, so you can parse the polled results and create an outbound stream of individual events. Below, every minute I’m listing records from ServiceNow that I publish to EventGrid.
Note that Amazon EventBridge also supports scheduled invocation of targets. Those targets include batch job queues, code pipelines, ECS tasks, Lambda functions, and more.
Option #3: Hack the subsystems to generate events
You’ll have cases where you don’t have APIs at all. Just give up? NEVER.
A last resort is poking into the underlying subsystems. That means generating events from file shares, FTP locations, queues, and databases. Now, be careful here. You need to REALLY know your software before doing this. If you create a change feed for the database that comes with your packaged software, you could end up with data integrity issues. So, I’d probably never do this unless it was a custom-built (or well-understood) system.
How do public cloud platforms help? Amazon EventBridge primarily integrates with AWS services today. That means if your custom or packaged app runs in AWS, you can trigger events off the foundational pieces. You might trigger events off EC2 state changes, new objects added to S3 blob storage, deleted users in the identity management system, and more. Most of these are about the service lifecycle, versus about the data going through the service, but still useful.
In Azure, the EventGrid service ingests events from lots of foundational Azure services. You can listen on many of the same types of things that Amazon EventBridge does. That includes blob storage, although nothing yet on virtual machines.
Your best bet in Azure may be once again to use Logic Apps and turn subsystem queries into an outbound event stream. In this example, I’m monitoring IBM DB2 database changes, and publishing events.
I could do the same with triggers on FTP locations …
… and file shares.
In all those cases, it’s fairly straightforward to publish the queried items to Azure EventGrid for fan-out processing to trigger-based recipient systems
Ideally, you have option #1 at your disposal. If not, you can selectively choose #2 or #3 to get more events flowing in your architecture. Are there other patterns and techniques you use to generate events out of existing systems?
Serverless things don’t always complete their work in milliseconds. With the introduction of AWS Step Functions and Azure Durable Functions, we have compute instances that exist for hours, days, or even months. With serverless workflow tools like Azure Logic Apps, it’s also easy to build long-running processes. So in this world of continuous delivery and almost-too-easy update processes, what happens when you update the underlying definition of things that have running instances? Do they use the version they started with? Do they pick up changes and run with those after waking up? Do they crash and cause the heat death of the universe? I was curious, so I tried it out.
Azure Durable Functions
Azure Durable Functions extends “regular” Azure Functions. They introduce a stateful processing layer by defining an “orchestrator” that calls Azure Functions, checkpoints progress, and manages intermediate state.
Let’s build one, and then update it to see what happens to the running instances.
First, I created a new Function App in the Azure Portal. A Function App holds individual functions. This one uses the “consumption plan” so I only pay for the time a function runs, and contains .NET-based functions. Also note that it provisions a storage account, which we’ll end up using for checkpointing.
Durable Functions are made up of a client function that create an orchestration, orchestration functions that coordinate work, and activity functions that actually do the work. From the Azure Portal, I could see a template for creating an HTTP client (or starter) function.
The function code generated by the template works as-is.
#r "Microsoft.Azure.WebJobs.Extensions.DurableTask"
#r "Newtonsoft.Json"

using System.Net;

public static async Task<HttpResponseMessage> Run(
    HttpRequestMessage req,
    DurableOrchestrationClient starter,
    string functionName,
    ILogger log)
{
    // Function input comes from the request content.
    dynamic eventData = await req.Content.ReadAsAsync<object>();

    // Pass the function name as part of the route
    string instanceId = await starter.StartNewAsync(functionName, eventData);

    log.LogInformation($"Started orchestration with ID = '{instanceId}'.");

    return starter.CreateCheckStatusResponse(req, instanceId);
}
Next I created the activity function. Like with the client function, the Azure Portal generates a working function from the template. It simply takes in a string, and returns a polite greeting.
The final step was to create the orchestrator function. The template-generated code is below. Notice that our orchestrator calls the “hello” function three times with three different inputs, and aggregates the return values into a single output.
After saving this function, I went back to the starter/client function and clicked the “Get function URL” link to get the URL I need to invoke to instantiate this orchestrator. Then, I plugged that into Postman, and submitted a POST request.
Since the Durable Function is working asynchronously, I get back URIs to check the status, or terminate the orchestrator. I invoked the “get status” endpoint, and saw the aggregated results returned from the orchestrator function.
So it all worked. Terrific. Next I wanted to add a delay in between activity function calls to simulate a long-running process. What’s interesting with Durable Functions is that every time it gets results back from an async call (or timer), it reruns the entire orchestrator from scratch. Now, it checks the execution log to avoid calling the same operation again, but this made me wonder how it would respond if I added *new* activities in the mix, or deleted activities.
First, I added some instrumentation to the orchestrator function (and injected function input) so that I could see more about what was happening. In the code below, if we’re not replaying activities (so, first time it’s being called), it traces out a message.
public static async Task<List<string>> Run(DurableOrchestrationContext context, ILogger log)
{
    var outputs = new List<string>();

    outputs.Add(await context.CallActivityAsync<string>("Hello", "Tokyo"));
    if (!context.IsReplaying) log.LogInformation("Called function once.");

    outputs.Add(await context.CallActivityAsync<string>("Hello", "Seattle"));
    if (!context.IsReplaying) log.LogInformation("Called function twice.");

    outputs.Add(await context.CallActivityAsync<string>("Hello", "London"));
    if (!context.IsReplaying) log.LogInformation("Called function thrice.");

    // returns ["Hello Tokyo!", "Hello Seattle!", "Hello London!"]
    return outputs;
}
After saving this update, I triggered the client function again, and with the streaming “Logs” view open in the Portal. Here, I saw trace statements for each call to an activity function.
A durable function supports Timers that pause processing for up to seven days. I added the following code between the second and third function calls. This pauses the function for 30 seconds.
    if (!context.IsReplaying) log.LogInformation("Starting delay.");
    DateTime deadline = context.CurrentUtcDateTime.Add(TimeSpan.FromSeconds(30));
    await context.CreateTimer(deadline, System.Threading.CancellationToken.None);
    if (!context.IsReplaying) log.LogInformation("Delay finished.");
If you trigger the client function again, it will take 30-ish seconds to get results back, as expected.
Next I tested three scenarios to see how Durable Functions handled them:
Wait until the orchestrator hits the timer, andchange the payload for an activity function call that executed before the timer started. What happens when the framework tries to re-run a step that’s changed? I changed the first function’s payload from “Tokyo” to “Mumbai” after the function instance had already passed the first call, and was paused at the timer. After the function resumed from the timer, the orchestrator failed with a message of: “Non-Deterministic workflow detected: TaskScheduledEvent: 0 TaskScheduled Hello.” Didn’t like that. Changing the call signature, or apparently even the payload is a no-no if you don’t want to break running instances.
Wait until the orchestrator hits the timer, and update the function to introduce a new activity function call in code above the timer. Does the framework execute that new function call when it wakes up and re-runs, or ignore it? Indeed, it runs it. So after the timer wrapped up, the NEW, earlier function call got invoked, AND it ran the timer again before continuing. That part surprised me, and it only kinda worked. Instead of returning the expected value from the activity function, I got a “2” back. And some times when I tested this, I got the above “non-deterministic workflow” error. So, your mileage may vary.
Add an activity call after the timer, and see if it executes it after the delay is over. Does the orchestrator “see” the new activity call I added to the code after it woke back up? The first time I tried this, I again got the “non-deterministic workflow” error, but with a few more tests, I saw it actually executed the new function after waking back up, AND running the timer a second time.
What have we learned? The “version” a Durable Function starts with isn’t serialized and used for the entirety of the execution. It’s picking up things changing along the way. Be very aware of side effects! For a number of these tests, I also had to “try again” and would see different results. I feel like I was breaking Azure Functions!
What’s the right way to version these? Microsoft offers some advice, which ranges from “do nothing and let things fail” to “deploy an entirely new function.” But from these tests, I’d advise against changing function definitions outside of explicitly deploying new versions.
Azure Logic Apps
Let’s take a look at Logic Apps. This managed workflow service is designed for constructing processes that integrate a variety of sources and targets. It supports hundreds of connectors to things likes Salesforce.com, Amazon Redshift, Slack, OneDrive, and more. A Logic App can run for 90 days in the multi-tenant environment, and up to a year in the dedicated environment. So, most users of Logic Apps are going to have instances in-flight when it comes time to deploy updates.
To test this out, I first created a couple of Azure Functions that Logic Apps could call. These JavaScript functions are super lame, and just return a greeting.
Next up, I created a Logic App. It’s easy.
After a few moments, I could jump in and start designing my workflow. As a “serverless” service, Logic Apps only run when invoked, and start with a trigger. I chose the HTTP trigger.
My Logic App takes in an HTTP request, has a 45 second “delay” (which could represent waiting for new input, or a long-running API call) before invoke our simple Azure Function.
I saved the Logic App, called the HTTP endpoint via Postman, and waited. After about 45 seconds, I saw that everything succeeded.
Next, I kicked off another instance, and quickly went in and added another Function call after the first one. What would Logic Apps do with that after the delay was over? It ignored the new function call. Then I kicked off another Logic Apps instance, and quickly deleted the second function call. Would the instance wake up and now only call one Function? Nope, it called them both.
So it appears that Logic Apps snapshot the workflow when it starts, and it executes that version, regardless of what changes in the underlying definition after the fact. That seems good. It results in a more consistent, predictable process. Logic Apps does have the concept of versioning, and you can promote previous versions to the active one as needed.
AWS Step Functions
AWS doesn’t have something exactly like Logic Apps, but AWS Step Functions is somewhat similar to Azure Durable Functions. With Step Functions, you can chain together a series of AWS services into a workflow. It basically builds a state machine that you craft in their JSON-based Amazon State Language. A given Step Function can be idle for up to a year, so again. you’ll probably have long-running instances going at all times!
I jumped into the AWS console and started with their “hello world” template.
This state machine has a couple basic states that execute immediately. Then I added a 20 second wait.
After deploying the Step Function, it was easy to see that it ran everything quickly and successfully.
Next, I kicked off a new instance, and added a new step to the state machine while the instance was waiting. The Step Function that was running ignored it.
When I kicked off another Step Function and removed the step after the wait step, it also ignored it. It seems pretty clear that AWS Step Functions snapshot the workflow at the start proceed with that snapshot, even if the underlying definition changes. I didn’t find much documentation around formally versioning Step Functions, but it seems to keep you fairly safe from side effects.
With all of these, it’s important to realize that you also have to consider versioning of downstream calls. I could have an unchanged Logic App, but the function or API it invokes had its plumbing entirely updated after the Logic App started running. There’s no way to snapshot the state of all the dependencies! That’s normal in a distributed system. But, something to remember.
Have you observed any different behavior with these stateful serverless products?
Serverless computing. Let’s talk about it. I don’t think it’s crazy to say that it represents the first cloud-native software model. Done right, it is inherently elastic and pay-per-use, and strongly encourages the use of cloud managed services. And to be sure, it’s about much more than just Function-as-a-Service platforms like AWS Lambda.
So, what exactly is it, why does it matter, and what technologies and architecture patterns should you know? To answer that question, I spent a few months researching the topic, and put together a new Pluralsight course, Serverless Computing: The Big Picture.
The course is only an hour long, but I get into some depth on benefits, challenges, and patterns you should know.
The first module looks at the various serverless definitions offered by industry experts, why serverless is different from what came before it, how serverless compares to serverful systems, challenges you may face adopting it, and example use cases.
The second module digs into the serverless tech that matters. I look at public cloud function-as-a-service platforms, installable platforms, dev tools, and managed services.
The final module of the course looks at architecture patterns. We start by looking at best practices, then review a handful of patterns.
As always, I had fun putting this together. It’s my 19th Pluralsight course, and I don’t see stopping any time soon. If you watch it, I’d love your feedback. I hope it helps you get a handle on this exciting, but sometimes-confusing, topic!