Category: Node.js

  • Three Ways to Run Apache Kafka in the Public Cloud

    Three Ways to Run Apache Kafka in the Public Cloud

    Yes, people are doing things besides generative AI. You’ve still got other problems to solve, systems to connect, and data to analyze. Apache Kafka remains a very popular product for event and data processing, and I was thinking about how someone might use it in the cloud right now. I think there are three major options, and one of them (built-in managed service) is now offered by Google Cloud. So we’ll take that for a spin.

    Option 1: Run it yourself on (managed) infrastructure

    Many companies choose to run Apache Kafka themselves on bare metal, virtual machines, or Kubernetes clusters. It’s easy to find stories about companies like Netflix, Pinterest, and Cloudflare running their own Apache Kafka instances. Same goes for big (and small) enterprises that choose to setup and operate dedicated Apache Kafka environments.

    Why do this? It’s the usual reasons why people decide to manage their own infrastructure! Kafka has a lot of configurability, and experienced folks may like the flexibility and cost profile of running Apache Kafka themselves. Pick your infrastructure, tune every setting, and upgrade on your timetable. On the downside, self-managed Apache Kafka can result in a higher total cost of ownership, requires specialized skills in-house, and could distract you from other high-priority work.

    If you want to go that route, I see a few choices.

    There’s no shame in going this route! It’s actually very useful to know how to run software like Apache Kafka yourself, even if you decide to switch to a managed service later.

    Option 2: Use a built-in managed service

    You might want Apache Kafka, but not want to run Apache Kafka. I’m with you. Many folks, including those at big web companies and classic enterprises, depend on managed services instead of running the software themselves.

    Why do this? You’d sign up for this option when you want the API, but not the ops. It may be more elastic and cost-effective than self-managed hosting. Or, it might cost more from a licensing perspective, but provide more flexibility on total cost of ownership. On the downside, you might not have full access to every raw configuration option, and may pay for features or vendor-dictated architecture choices you wouldn’t have made yourself.

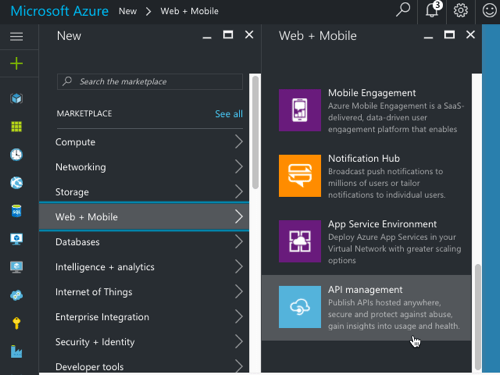
    AWS offers an Amazon Managed Streaming for Apache Kafka product. Microsoft doesn’t offer a managed Kafka product, but does provide a subset of the Apache Kafka API in front of their Azure Event Hubs product. Oracle cloud offers self-managed infrastructure with a provisioning assist, but also appears to have a compatible interface on their Streaming service.

    Google Cloud didn’t offer any native service until just a couple of months ago. The Apache Kafka for BigQuery product is now in preview and looks pretty interesting. It’s available in a global set of regions, and provides a fully-managed set of brokers that run in a VPC within a tenant project. Let’s try it out.

    Set up prerequisites

    First, I needed to enable the API within Google Cloud. This gave me the ability to use the service. Note that this is NOT FREE while in preview, so recognize that you’ll incur changes.

    Next, I wanted a dedicated service account for accessing the Kafka service from client applications. The service supports OAuth and SASL_PLAIN with service account keys. The latter is appropriate for testing, so I chose that.

    I created a new service account named seroter-bq-kafka and gave it the roles/managedkafka.client role. I also created a JSON private key and saved it to my local machine.

    That’s it. Now I was ready to get going with the cluster.

    Provision the cluster and topic

    I went into the Apache Kafka for BigQuery dashboard in the Google Cloud console—I could have also used the CLI which has the full set of control plane commands—to spin up a new cluster. I get very few choices, and that’s not a bad thing. You give the CPU and RAM capacity for the cluster, and Google Cloud creates the right shape for the brokers, and creates a highly available architecture. You’ll also see that I choose the VPC for the cluster, but that’s about it. Pretty nice!

    In about twenty minutes, my cluster was ready. Using the console or CLI, I could see the details of my cluster.

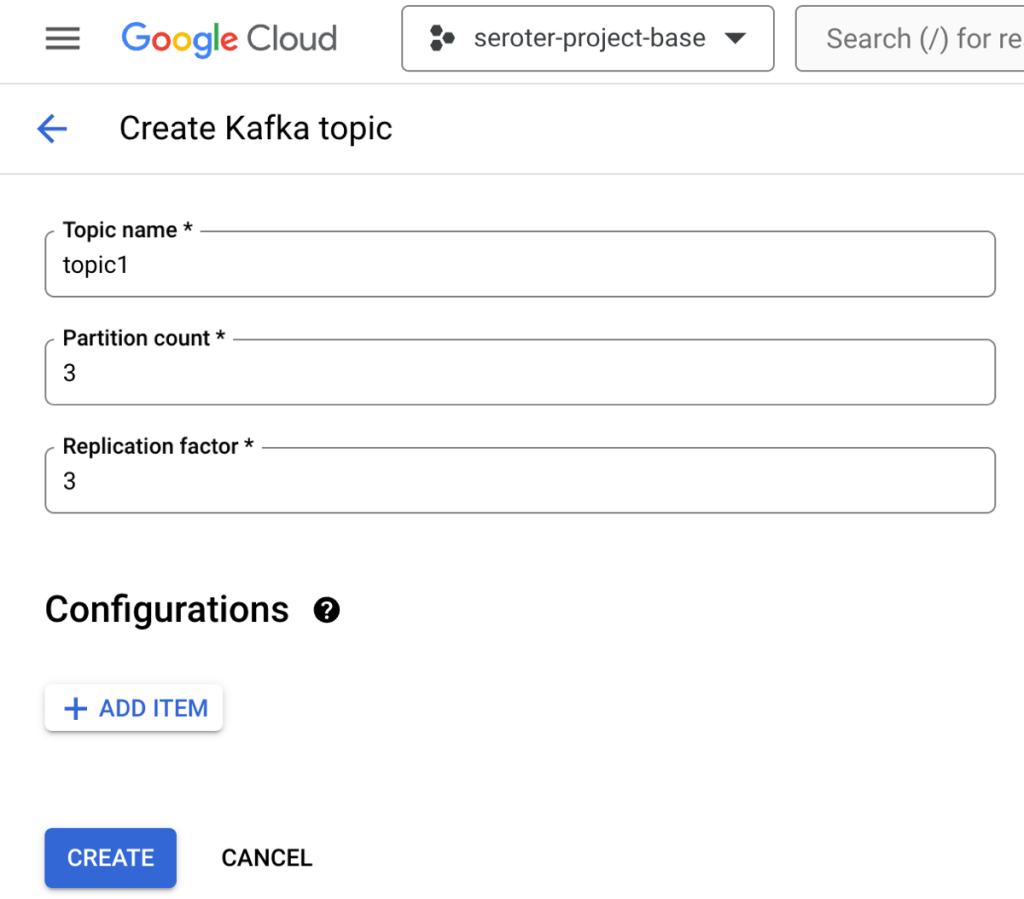
    Topics are a core part of Apache Kafka represent the resource you publish and subscribe to. I could create a topic via the UI or CLI. I created a topic called “topic1”.

    Build the producer and consumer apps

    I wanted two client apps. One to publish new messages to Apache Kafka, and another to consume messages. I chose Node.js and JavaScript as the language for the app. There are a handful of libraries for interacting with Apache Kafka, and I chose the mature kafkajs.

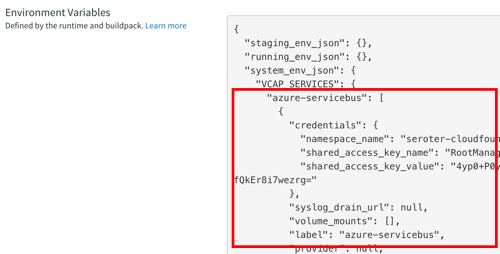
    Let’s start with the consuming app. I need (a) the cluster’s bootstrap server URL and (b) the encoded client credentials. We access the cluster through the bootstrap URL and it’s accessible via the CLI or the cluster details (see above). The client credentials for SASL_PLAIN authentication consists of the base64 encoded service account key JSON file.

    My index.js file defines a Kafka object with the client ID (which identifies our consumer), the bootstrap server URL, and SASL credentials. Then I define a consumer with a consumer group ID and subscribe to the “topic1” we created earlier. I process and log each message before appending to an array variable. There’s an HTTP GET endpoint that returns the array. See the whole index.js below, and the GitHub repo here.

    const express = require('express');
    const { Kafka, logLevel } = require('kafkajs');
    const app = express();
    const port = 8080;
    
    const kafka = new Kafka({
      clientId: 'seroter-consumer',
      brokers: ['bootstrap.seroter-kafka.us-west1.managedkafka.seroter-project-base.cloud.goog:9092'],
      ssl: {
        rejectUnauthorized: false
      },
      logLevel: logLevel.DEBUG,
      sasl: {
        mechanism: 'plain', // scram-sha-256 or scram-sha-512
        username: 'seroter-bq-kafka@seroter-project-base.iam.gserviceaccount.com',
        password: 'tybgIC ... pp4Fg=='
      },
    });
    
    const consumer = kafka.consumer({ groupId: 'message-retrieval-group' });
    
    //create variable that holds an array of "messages" that are strings
    let messages = [];
    
    async function run() {
      await consumer.connect();
      //provide topic name when subscribing
      await consumer.subscribe({ topic: 'topic1', fromBeginning: true }); 
    
      await consumer.run({
        eachMessage: async ({ topic, partition, message }) => {
          console.log(`################# Received message: ${message.value.toString()} from topic: ${topic}`);
          //add message to local array
          messages.push(message.value.toString());
        },
      });
    }
    
    app.get('/consume', (req, res) => {
        //return the array of messages consumed thus far
        res.send(messages);
    });
    
    run().catch(console.error);
    
    app.listen(port, () => {
      console.log(`App listening at http://localhost:${port}`);
    });
    

    Now we switch gears and go through the producer app that publishes to Apache Kafka.

    This app starts off almost identically to the consumer app. There’s a Kafka object with a client ID (different for the producer) and the same pointer to the bootstrap server URL and credentials. I’ve got an HTTP GET endpoint that takes the querystring parameters and publishes the key and value content to the request payload. The code is below, and the GitHub repo is here.

    const express = require('express');
    const { Kafka, logLevel } = require('kafkajs');
    const app = express();
    const port = 8080; // Use a different port than the consumer app
    
    const kafka = new Kafka({
        clientId: 'seroter-publisher',
        brokers: ['bootstrap.seroter-kafka.us-west1.managedkafka.seroter-project-base.cloud.goog:9092'],
        ssl: {
          rejectUnauthorized: false
        },
        logLevel: logLevel.DEBUG,
        sasl: {
          mechanism: 'plain', // scram-sha-256 or scram-sha-512
          username: 'seroter-bq-kafka@seroter-project-base.iam.gserviceaccount.com',
          password: 'tybgIC ... pp4Fg=='
        },
      });
    
    const producer = kafka.producer();
    
    app.get('/publish', async (req, res) => {
      try {
        await producer.connect();
    
        const _key = req.query.key; // Extract key from querystring
        console.log('key is ' + _key);
        const _value = req.query.value // Extract value from querystring
        console.log('value is ' + _value);
    
        const message = {
          key: _key, // Optional key for partitioning
          value: _value
        };
    
        await producer.send({
          topic: 'topic1', // Replace with your topic name
          messages: [message]
        });
    
        res.status(200).json({ message: 'Message sent successfully' });
    
      } catch (error) {
        console.error('Error sending message:', error);
        res.status(500).json({ error: 'Failed to send message' });
      }
    });
    
    app.listen(port, () => {
      console.log(`Producer listening at http://localhost:${port}`);
    });


    Next up, containerizing both apps so that I could deploy to a runtime.

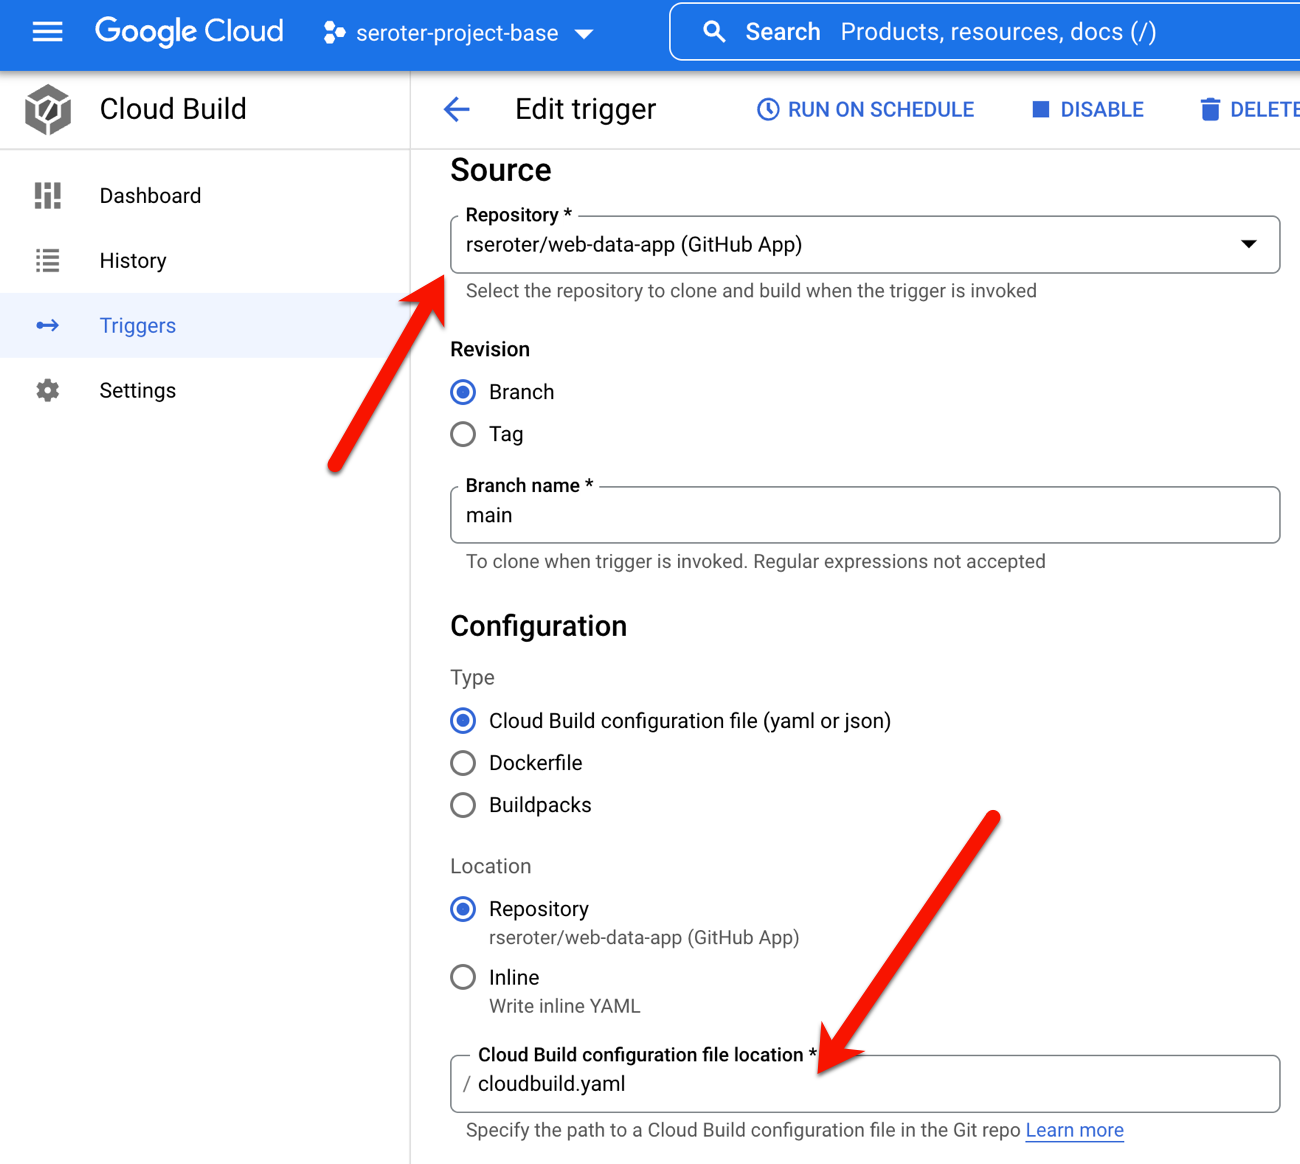
    I used Google Cloud Artifact Registry as my container store, and created a Docker image from source code using Cloud Native buildpacks. It took one command for each app:

    gcloud builds submit --pack image=gcr.io/seroter-project-base/seroter-kafka-consumer
    gcloud builds submit --pack image=gcr.io/seroter-project-base/seroter-kafka-publisher

    Now we had everything needed to deploy and test our client apps.

    Deploy apps to Cloud Run and test it out

    I chose Google Cloud Run because I like nice things. It’s still one of the best two or three ways to host apps in the cloud. We also make it much easier now to connect to a VPC, which is what I need. Instead of creating some tunnel out of my cluster, I’d rather access it more securely.

    Here’s how I configured the consuming app. I first picked my container image and a target location.

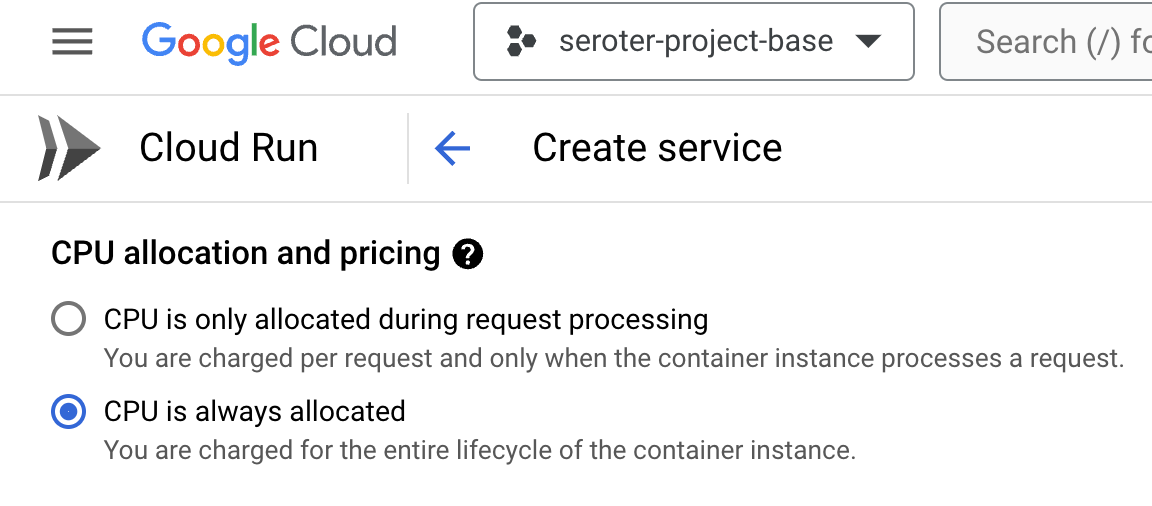
    Then I chose to use always-on CPU for the consumer, as I had connection issues when I had a purely ephemeral container.

    The last setting was the VPC egress that made it possible for this instance to talk to the Apache Kafka cluster.

    About three seconds later, I had a running Cloud Run instance ready to consume.

    I ran through a similar deployment process for the publisher app, except I kept the true “scale to zero” setting turned on since it doesn’t matter if the publisher app comes and goes.

    With all apps deployed, I fired up the browser and issued a pair of requests to the “publish” endpoint.

    I checked the consumer app’s logs and saw that messages were successfully retrieved.

    Sending a request to the GET endpoint on the consumer app returns the pair of messages I sent from the publisher app.

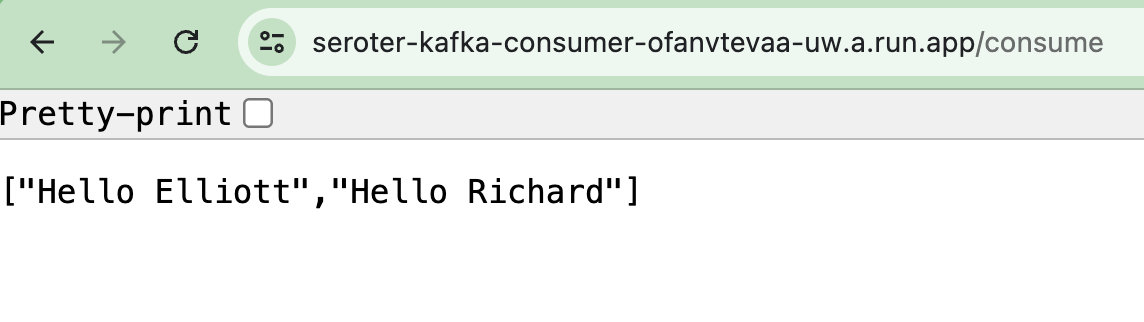
    Sweet! We proved that we could send messages to the Apache Kafka cluster, and retrieve them. I get all the benefits of Apache Kafka, integrated into Google Cloud, with none of the operational toil.

    Read more in the docs about this preview service.

    Option 3: Use a managed provider on your cloud(s) of choice

    The final way you might choose to run Apache Kafka in the cloud is to use a SaaS product designed to work on different infrastructures.

    The team at Confluent does much of the work on open source Apache Kafka and offers a managed product via Confluent Cloud. It’s performant, feature-rich, and runs in AWS, Azure, and Google Cloud. Another option is Redpanda, who offer a managed cloud service that they operate on their infrastructure in AWS or Google Cloud.

    Why do this? Choosing a “best of breed” type of managed service is going to give you excellent feature coverage and operational benefits. These platforms are typically operated by experts and finely tuned for performance and scale. Are there any downside? These platforms aren’t free, and don’t always have all the native integrations into their target cloud (logging, data services, identity, etc) that a built-in service does. And you won’t have all the configurability or infrastructure choice that you’d have running it yourself.

    Wrap up

    It’s a great time to run Apache Kafka in the cloud. You can go full DIY or take advantage of managed services. As always, there are tradeoffs with each. You might even use a mix of products and approaches for different stages (dev/test/prod) and departments within your company. Are there any options I missed? Let me know!

  • Continuously deploy your apps AND data? Let’s try to use Liquibase for BigQuery changes.

    Continuously deploy your apps AND data? Let’s try to use Liquibase for BigQuery changes.

    Want to constantly deploy updates to your web app through the use of automation? Not everyone does it, but it’s a mostly solved problem with mature patterns and tools that make it possible. Automated deployments of databases, app services, and data warehouses? Also possible, but not something I personally see done as often. Let’s change that!

    Last month, I was tweeting about Liquibase, and their CTO and co-founder pointed out to me that Google Cloud contributed a BigQuery extension. Given that Liquibase is a well-known tool for automating database changes, I figured it was time to dig in and see how it worked, especially for a fully managed data warehouse like BigQuery. Specifically, I wanted to prove out four things:

    1. Use the Liquibase CLI locally to add columns to a BigQuery table. This is an easy way to get started!
    2. Use the Liquibase Docker image to add columns to a BigQuery table. See how to deploy changes through a Docker container, which makes later automation easier.
    3. Use the Liquibase Docker image within Cloud Build to automate deployment of a BigQuery table change. Bring in continuous integration (and general automation service) Google Cloud Build to invoke the Liquibase container to push BigQuery changes.
    4. Use Cloud Build and Cloud Deploy to automate the build and deployment of the app to GKE along with a BigQuery table change. This feels like the ideal state, where Cloud Build does app packaging, and then hands off to Cloud Deploy to push BigQuery changes (using the Docker image) and the web app through dev/test/prod.

    I learned a lot of new things by performing this exercise! I’ll share all my code and lessons learned about Docker, Kubernetes, init containers, and Liquibase throughout this post.

    Scenario #1 – Use Liquibase CLI

    The concepts behind Liquibase are fairly straightforward: define a connection string to your data source, and create a configuration file that represents the desired change to your database. A Liquibase-driven change isn’t oriented adding data itself to a database (although, it can), but for making structural changes like adding tables, creating views, and adding foreign key constraints. Liquibase also does things like change tracking, change locks, and assistance with rollbacks.

    While it directly integrates with Java platforms like Spring Boot, you can also use it standalone via a CLI or Docker image.

    I downloaded the CLI installer for my Mac, which added the bits to a local directory. And then I checked to see if I could access the liquibase CLI from the console.

    Next, I downloaded the BigQuery JDBC driver which is what Liquibase uses to connect to my BigQuery. The downloaded package includes the JDBC driver along with a “lib” folder containing a bunch of dependencies.

    I added *all* of those files—the GoogleBigQueryJDBC42.jar file and everything in the “lib” folder—to the “lib” folder included in the liquibase install directory.

    Next, I grabbed the latest BigQuery extension for Liquibase and installed that single JAR file into the same “lib” folder in the local liquibase directory. That’s it for getting the CLI properly loaded.

    What about BigQuery itself? Anything to do there? Not really. When experimenting, I got “dataset not found” from Liquibase when using a specific region like “us-west1” so I created a dataset the wider “US” region and everything worked fine.

    I added a simple table to this dataset and started it off with two columns.

    Now I was ready to trigger some BigQuery changes! I had a local folder (doesn’t need to be where the CLI was installed) with two files: liquibase.properties, and changelog.yaml. The properties file (details here) includes the database connection string, among other key attributes. I turned on verbose logging, which was very helpful in finding obscure issues with my setup! Also, I want to use environmental credentials (saved locally, or available within a cloud instance by default) versus entering creds in the file, so the OAuthType is set to “3”.

    #point to where the file is containing the changelog to execute
    changelogFile: changelog.yaml
    #identify which driver to use for connectivity
    driver: com.simba.googlebigquery.jdbc.Driver
    #set the connection string for bigquery
    url: jdbc:bigquery://https://googleapis.com/bigquery/v2:443;ProjectId=seroter-project-base;DefaultDataset=employee_dataset;OAuthType=3;
    #log all the things
    logLevel: 0
    #if not using the "hub" features
    liquibase.hub.mode=off
    

    Next I created the actual change log. There are lots of things you can do here, and change files can be authored in JSON, XML, SQL, or YAML. I chose YAML, because I know how to have a good time. The BigQuery driver supports most of the Liquibase commands, and I chose the one to add a new column to my table.

    databaseChangeLog:
      - changeSet:
          id: addColumn-example1
          author: rseroter
          changes:
            - addColumn:
                tableName: names_1
                columns:
                - column:
                    name: location
                    type: STRING
    

    Once you get all the setup in place, the actual Liquibase stuff is fairly simple! To execute this change, I jumped into the CLI, navigated to the folder holding the properties file and change log, and issued a single command.

    liquibase --changeLogFile=changelog.yaml update

    Assuming you have all the authentication and authorization settings correct and files defined and formatted in the right way, the command should complete successfully. In BigQuery, I saw that my table had a new column.

    Note that this command is idempotent. I can execute it again and again with no errors or side effects. After I executed the command, I saw two new tables added to my dataset. If I had set the “liquibaseSchemaName” property in the properties file, I could have put these tables into a different dataset of my choosing. What are they for? The DATABASECHANGELOGLOCK table is used to create a “lock” on the database change so that only one process at a time can make updates. The DATABASECHANGELOG table stores details of what was done, when. Be aware that each changeset itself is unique, so if I tried to run a new change (add a different column) with the same changeset id (above, set to “addColumn-example1”), I’d get an error.

    That’s it for the CLI example. Not too bad!

    Scenario #2 – Use Liquibase Docker image

    The CLI is cool, but maybe you want an even more portable way to trigger a database change? Liquibase offers a Docker image that has the CLI and necessary bits loaded up for you.

    To test this out, I fired up an instance of the Google Cloud Shell—this is an dev environment that you can access within our Console or standalone. From here, I created a local directory (lq) and added folders for “changelog” and “lib.” I uploaded all the BigQuery JDBC JAR files, as well as the Liquibase BigQuery driver JAR file.

    I also uploaded the liquibase.properties file and changelog.yaml file to the “changelog” folder in my Cloud Shell. I opened the changelog.yaml file in the editor, and updated the changeset identifier and set a new column name.

    All that’s left is to start the Docker container. Note that you might find it easier to create a new Docker image based on the base Liquibase image with all the extra JAR files embedded within it instead of schlepping the JARs all over the place. In my case here, I wanted to keep it all separate. To ensure that the Liquibase Docker container “sees” all my config files and JAR files, I needed to mount volumes when I started the container. The first volume mount maps from my local “changelog” directory to the “/liquibase/changelog” directory in the container. The second maps from the local “lib” directory to the right spot in the container. And by mounting all those JARs into the container’s “lib” directory—while also setting the “–include-system-classpath” flag to ensure it loads everything it finds there—the container has everything it needs. Here’s the whole Docker command:

    docker run --rm -v /home/richard/lq/changelog:/liquibase/changelog -v /home/richard/lq/lib:/liquibase/lib liquibase/liquibase --include-system-classpath=true --changeLogFile=changelog/changelog.yaml --defaultsFile=/liquibase/changelog/liquibase.properties update
    

    After 30 seconds or so, I saw the new column added to my BigQuery table.

    To be honest, this doesn’t feel like it’s that much simpler than just using the CLI, but, by learning how to use the container mechanism, I could now embed this database change process into a container-native cloud build tool.

    Scenario #3 – Automate using Cloud Build

    Those first two scenarios are helpful for learning how to do declarative changes to your database. Now it’s time to do something more automated and sustainable. In this scenario, I tried using Google Cloud Build to automate the deployment of my database changes.

    Cloud Build runs each “step” of the build process in a container. These steps can do all sorts of things, ranging from compiling your code, running tests, pushing to artifact storage, or deploy a workload. Since it can honestly run any container, we could also use the Liquibase container image as a “step” of the build. Let’s see how it works.

    My first challenge related to getting all those JDBC and driver JAR files into Cloud Build! How could the Docker container “see” them? To start, I put all the JAR files and config files (updated with a new column named “title”) into Google Cloud Storage buckets. This gave me easy, anywhere access to the files.

    Then, I decided to take advantage of Cloud Build’s built-in volume for sharing data between the independent build steps. This way, I could retrieve the files, store them, and then the Liquibase container could see them on the shared volume. In real life, you’d probably grab the config files from a Git repo, and the JAR files from a bucket. We’ll do that in the next scenario! Be aware that there’s also a project out there for mounting Cloud Storage buckets as volumes, but I didn’t feel like trying to do that. Here’s my complete Cloud Build manifest:

    steps: 
    - id: "Get Liquibase Jar files"
      name: 'gcr.io/cloud-builders/gsutil'
      dir: 'lib'
      args: ['cp', 'gs://liquibase-jars/*.jar', '/workspace/lib']
    - id: "Get Liquibase config files"
      name: 'gcr.io/cloud-builders/gsutil'
      dir: 'changelog'
      args: ['cp', 'gs://liquibase-configs/*.*', '/workspace/changelog']
    - id: "Update BQ"
      name: 'gcr.io/cloud-builders/docker'
      args: [ "run", "--network=cloudbuild", "--rm", "--volume", "/workspace/changelog:/liquibase/changelog", "--volume", "/workspace/lib:/liquibase/lib", "liquibase/liquibase", "--include-system-classpath=true", "--changeLogFile=changelog/changelog.yaml", "--defaultsFile=/liquibase/changelog/liquibase.properties", "update" ]
    

    The first “step” uses a container that’s pre-loaded with the Cloud Storage CLI. I executed the “copy” command and put all the JAR files into the built-in “workspace” volume. The second step does something similar by grabbing all the “config” files and dropping them into another folder within the “workspace” volume.

    Then the “big” step executed a virtually identical Docker “run” command as in scenario #2. I pointed to the “workspace” directories for the mounted volumes. Note the “–network” flag which is a magic command for using default credentials.

    I jumped into the Google Cloud Console and created a new Cloud Build trigger. Since I’m not (yet) using a git repo for configs, but I have to pick SOMETHING when building a trigger, I chose a random repo of mine. I chose an “inline” Cloud Build definition and pasted in the YAML above.

    That’s it. I saved the trigger, ensured the “Cloud Build” account had appropriate permissions to update BigQuery, and “ran” the Cloud Build job.

    I saw the new column in my BigQuery table as a result and if I looked at the “change table” managed by Liquibase, I saw each of the three change we did so far.

    Scenario #4 – Automate using Cloud Build and Cloud Deploy

    So far so good. But it doesn’t feel “done” yet. What I really want is to take a web application that writes to BigQuery, and deploy that, along with BigQuery changes, in one automated process. And I want to use the “right” tools, so I should use Cloud Build to package the app, and Google Cloud Deploy to push the app to GKE.

    I first built a new web app using Node.js. This very simple app asks you to enter the name of an employee, and it adds that employee to a BigQuery table. I’m seeking seed funding for this app now if you want to invest. The heart of this app’s functionality is in its router:

    router.post('/', async function(req, res, next) {
        console.log('called post - creating row for ' + req.body.inputname)
    
        const row = [
            {empid: uuidv4(), fullname: req.body.inputname}
          ];
    
        // Insert data into a table
        await bigquery
        .dataset('employee_dataset')
        .table('names_1')
        .insert(row);
        console.log(`Inserted 1 rows`);
    
    
        res.render('index', { title: 'Employee Entry Form' });
      });
    

    Before defining our Cloud Build process that packages the app, I wanted to create all the Cloud Deploy artifacts. These artifacts consist of a set of Kubernetes deployment files, a Skaffold configuration, and finally, a pipeline definition. The Kubernetes deployments get associated to a profile (dev/prod) in the Skaffold file, and the pipeline definition identifies the target GKE clusters.

    Let’s look at the Kubernetes deployment file for the “dev” environment. To execute the Liquibase container before deploying my Node.js application, I decided to use Kubernetes init containers. These run (and finish) before the actual container you care about. But I had the same challenge as with Cloud Build. How do I pass the config files and JAR files to the Liquibase container? Fortunately, Kubernetes offers up Volumes as well. Basically, the below deployment file does the following things:

    • Create an empty volume called “workspace.”
    • Runs an init container that executes a script to create the “changelog” and “lib” folders in the workspace volume. For whatever reason, the Cloud Storage CLI wouldn’t do it automatically for me, so I added this distinct step.
    • Runs an init container that git clones the latest config files from my GitHub project (no longer using Cloud Storage) and stashes them in the “changelog” directory in the workspace volume.
    • Runs a third init container to retrieve the JAR files from Cloud Storage and stuff them into the “lib” directory in the workspace volume.
    • Runs a final init container that mounts each directory to the right place in the container (using subpath references), and runs the “liquibase update” command.
    • Runs the application container holding our web app.
    apiVersion: apps/v1
    kind: Deployment
    metadata:
      name: db-ci-deployment-dev
    spec:
      replicas: 1
      selector:
        matchLabels:
          app: web-data-app-dev
      template:
        metadata:
          labels:
            app: web-data-app-dev
        spec:
          volumes:
          - name: workspace
            emptyDir: {}
          initContainers:
            - name: create-folders
              image: alpine
              command:
              - /bin/sh
              - -c
              - |
                cd liquibase
                mkdir changelog
                mkdir lib
                ls
                echo "folders created"
              volumeMounts:
              - name: workspace
                mountPath: /liquibase
                readOnly: false      
            - name: preload-changelog
              image: bitnami/git
              command:
              - /bin/sh
              - -c
              - |
                git clone https://github.com/rseroter/web-data-app.git
                cp web-data-app/db_config/* liquibase/changelog
                cd liquibase/changelog
                ls
              volumeMounts:
              - name: workspace
                mountPath: /liquibase
                readOnly: false
            - name: preload-jars
              image: gcr.io/google.com/cloudsdktool/cloud-sdk
              command: ["gsutil"]
              args: ['cp', 'gs://liquibase-jars/*', '/liquibase/lib/']
              volumeMounts:
              - name: workspace
                mountPath: /liquibase
                readOnly: false
            - name: run-lq
              image: liquibase/liquibase
              command: ["liquibase"]
              args: ['update', '--include-system-classpath=true', '--changeLogFile=/changelog/changelog.yaml', '--defaultsFile=/liquibase/changelog/liquibase.properties']
              volumeMounts:
              - name: workspace
                mountPath: /liquibase/changelog
                subPath: changelog
                readOnly: false
              - name: workspace
                mountPath: /liquibase/lib
                subPath: lib
                readOnly: false
          containers:
          - name: web-data-app-dev
            image: web-data-app
            env:
            - name: PORT
              value: "3000"
            ports:
              - containerPort: 3000
            volumeMounts:
            - name: workspace
              mountPath: /liquibase
    

    The only difference between the “dev” and “prod” deployments is that I named the running containers something different. Each deployment also has a corresponding “service.yaml” file that exposes the container with a public endpoint.

    Ok, so we have configs. That’s the hard part, and took me the longest to figure out! The rest is straightforward.

    I defined a skaffold.yaml file which Cloud Deploy uses to render right assets for each environment.

    apiVersion: skaffold/v2beta16
    kind: Config
    metadata:
     name: web-data-app-config
    profiles:
     - name: prod
       deploy:
         kubectl:
           manifests:
             - deployment-prod.yaml
             - service-prod.yaml
     - name: dev
       deploy:
         kubectl:
           manifests:
             - deployment-dev.yaml
             - service-dev.yaml
    

    Skaffold is a cool tool for local development, but I won’t go into it here. The only other asset we need for Cloud Deploy is the actual pipeline definition! Here, I’m pointing to my two Google Kubernetes Engine clusters (with platform-wide access scopes) that represent dev and prod environments.

    apiVersion: deploy.cloud.google.com/v1
    kind: DeliveryPipeline
    metadata:
     name: data-app-pipeline
    description: application pipeline for app and BQ changes
    serialPipeline:
     stages:
     - targetId: devenv
       profiles:
       - dev
     - targetId: prodenv
       profiles:
       - prod
    ---
    
    apiVersion: deploy.cloud.google.com/v1
    kind: Target
    metadata:
     name: devenv
    description: development GKE cluster
    gke:
     cluster: projects/seroter-project-base/locations/us-central1-c/clusters/cluster-seroter-gke-1110
    
    ---
    
    apiVersion: deploy.cloud.google.com/v1
    kind: Target
    metadata:
     name: prodenv
    description: production GKE cluster
    gke:
     cluster: projects/seroter-project-base/locations/us-central1-c/clusters/cluster-seroter-gke-1117
    

    I then ran the single command to deploy that pipeline (which doesn’t yet care about the Skaffold and Kubernetes files):

    gcloud deploy apply --file=clouddeploy.yaml --region=us-central1 --project=seroter-project-base
    

    In the Cloud Console, I saw a visual representation of my jazzy new pipeline.

    The last step is to create the Cloud Build definition which builds my Node.js app, stashes it into Google Cloud Artifact Registry, and then triggers a Cloud Deploy “release.” You can see that I point to the Skaffold file, which in turns knows where the latest Kubernetes deployment/service YAML files are at. Note that I use a substitution value here with –images where the “web-data-app” value in each Kubernetes deployment file gets swapped out with the newly generated image identifier.

    steps:
      - name: 'gcr.io/k8s-skaffold/pack'
        id: Build Node app
        entrypoint: 'pack'
        args: ['build', '--builder=gcr.io/buildpacks/builder', '--publish', 'gcr.io/$PROJECT_ID/web-data-app:$COMMIT_SHA']
      - name: gcr.io/google.com/cloudsdktool/cloud-sdk
        id: Create Cloud Deploy release
        args: 
            [
              "deploy", "releases", "create", "test-release-$SHORT_SHA",
              "--delivery-pipeline", "data-app-pipeline",
              "--region", "us-central1",
              "--images", "web-data-app=gcr.io/$PROJECT_ID/web-data-app:$COMMIT_SHA",
              "--skaffold-file", "deploy_config/skaffold.yaml"
            ]
        entrypoint: gcloud
    

    To make all this magic work, I went into Google Cloud Build to set up my new trigger. It points at my GitHub repo and refers to the cloudbuild.yaml file there.

    I ran my trigger manually (I could also set it to run on every check-in) to build my app and initiate a release in Cloud Deploy. The first part ran quickly and successfully.

    The result? It worked! My “dev” GKE cluster got a new workload and service endpoint, and my BigQuery table got a new column.

    When I went back into Cloud Deploy, I “promoted” this release to production and it ran the production-aligned files and popped a workload into the other GKE cluster. And it didn’t make any BigQuery changes, because we already did on the previous run. In reality, you would probably have different BigQuery tables or datasets for each environment!

    Wrap up

    Did you make it this far? You’re amazing. It might be time to shift from just shipping the easy stuff through automation to shipping ALL the stuff via automation. Software like Liquibase definition gets you further along in the journey, and it’s good to see Google Cloud make it easier.

  • Fronting web sites, a classic .NET app, and a serverless function with Spring Cloud Gateway

    Fronting web sites, a classic .NET app, and a serverless function with Spring Cloud Gateway

    Automating deployment of custom code and infrastructure? Not always easy, but feels like a solved problem. It gets trickier when you want to use automation to instantiate and continuously update databases and middleware. Why? This type of software stores state which makes upgrades more sensitive. You also may be purchasing this type of software from vendors who haven’t provided a full set of automation-friendly APIs. Let’s zero in on one type of middleware: API gateways.

    API gateways do lots of things. They selectively expose private services to wider audiences. With routing rules, they make it possible to move clients between versions of a service without them noticing. They protect downstream services by offering capabilities like rate limiting and caching. And they offer a viable way for those with a microservices architecture to secure services without requiring each service to do their own authentication. Historically, your API gateway was a monolith of its own. But a new crop of automation-friendly OSS (and cloud-hosted) options are available, and this gives you new ways to deploy many API gateway instances that get continuously updated.

    I’ve been playing around with Spring Cloud Gateway, which despite its name, can proxy traffic to a lot more than just Spring Boot applications. In fact, I wanted to try and create a configuration-only-no-code API Gateway that could do three things:

    1. Weighted routing between “regular’ web pages on the internet.
    2. Add headers to a JavaScript function running in Microsoft Azure.
    3. Performing rate-limiting on a classic ASP.NET Web Service running on the Pivotal Platform.

    Before starting, let me back up and briefly explain what Spring Cloud Gateway is. Basically, it’s a project that turns a Spring Boot app into an API gateway that routes requests while applying cross-cutting functionality for things like security. Requests come in, and if the request matches a declared route, the request is passed through a series of filters, sent to the target endpoint, and “post” filters get applied on the way back to the client. Spring Cloud Gateway built on a Reactive base, which means it’s non-blocking and efficiently handles many simultaneous requests.

    The biggest takeaway? This is just an app. You can write tests and do continuous integration. You can put it on a pipeline and continuously deliver your API gateway. That’s awesome.

    Note that you can easily follow along with the steps below without ANY Java knowledge! Everything I’m doing using configuration you can also do with the Java DSL, but I wanted to prove how straightforward the configuration-only option is.

    Creating the Spring Cloud Gateway project

    This is the first, and easiest, part of this demonstration. I went to start.spring.io, and generated a new Spring Boot project. This project has dependencies on Gateway (to turn this into an API gateway), Spring Data Reactive Redis (for storing rate limiting info), and Spring Boot Actuator (so we get “free” metrics and insight into the gateway). Click this link to generate an identical project.

    Doing weighed routing between web pages

    For the first demonstration, I wanted to send traffic to either spring.io or pivotal.io/spring-app-framework. You might use weighted routing to do A/B testing with different versions of your site, or even to send a subset of traffic to a new API.

    I added an application.yml file (to replace the default application.properties file) to hold all my configuration settings. Here’s the configuration, and we’ll go through it bit by bit.

    spring:
      cloud:
        gateway:
          routes:
          # doing weighted routing between two sites
          - id: test1
            uri: https://www.pivotal.io
            predicates:
            - Path=/spring
            - Weight=group1, 3
            filters:
            - SetPath=/spring-app-framework
          - id: test2
            uri: https://www.spring.io
            predicates:
            - Path=/spring
            - Weight=group1, 7
            filters:
            - SetPath=/
    

    Each “route” is represented by a section in the YAML configuration. A route has a URI (which represents the downstream host), and a route predicate that indicates the path on the gateway you’re invoking. For example, in this case, my path is “/spring” which means that sending a request to “localhost:8080/spring” would map to this route configuration.

    Now, you’ll see I have two routes with the same path. These are part of the same weighted routing group, which means that traffic to /spring will go to one of the two downstream endpoints. The second endpoint is heavily weighted (7 vs 3), so most traffic goes there. Also see that I applied one filter to clear out the path. If I didn’t do this, then requests to localhost:8080/spring would result in a call to spring.io/spring, as the path (and querystring) is forwarded. Instead, I stripped that off for requests to spring.io, and added the secondary path into the pivotal.io endpoint.

    I’ve got Java and Maven installed locally, so a simple command (mvn spring-boot:run) starts up my Spring Cloud Gateway. Note that so far, I’ve written exactly zero code. Thanks to Spring Boot autoconfiguration and dependency management, all the right packages exist and runtime objects get inflated. Score!

    Once, the Spring Cloud Gateway was up and running, I pinged the Gateway’s endpoint in the browser. Note that some browser’s try to be helpful by caching things, which screws up a weighted routing demo! I opened the Chrome DevTools and disabled request caching before running a test.

    That worked great. Our gateway serves up a single endpoint, but through basic configuration, I can direct a subset of traffic somewhere else.

    Adding headers to serverless function calls

    Next, I wanted to stick my gateway in front of some serverless functions running in Azure Functions. You could imagine having a legacy system that you were slowly strangling and replacing with managed services, and leveraging Spring Cloud Gateway to intercept calls and redirect to the new destination.

    For this example, I built a dead-simple JavaScript function that’s triggered via HTTP call. I added a line of code that prints out all the request headers before sending a response to the caller.

    The Spring Cloud Gateway configuration is fairly simple. Let’s walk through it.

    spring:
      cloud:
        gateway:
          routes:
          # doing weighted routing between two sites
          - id: test1
            ...
          # adding a header to an Azure Function request
          - id: test3
            uri: https://seroter-function-app.azurewebsites.net
            predicates:
            - Path=/function
            filters:
            - SetPath=/api/HttpTrigger1
            - SetRequestHeader=X-Request-Seroter, Pivotal
    

    Like before, I set the URI to the target host, and set a gateway path. On the pre-filters, I reset the path (removing the /function and replacing with the “real” path to the Azure Function) and added a new request header.

    I started up the Spring Cloud Gateway project and sent in a request via Postman. My function expects a “name” value, which I provided as a query parameter.

    I jumped back to the Azure Portal and checked the logs associated with my Azure Function. Sure enough, I see all the HTTP request headers, including the random one that I added via the gateway. You could imagine this type of functionality helping if you have modern endpoints and legacy clients and need to translate between them!

    Applying rate limiting to an ASP.NET Web Service

    You know what types of apps can benefit from an API Gateway? Legacy apps that weren’t designed for high load or modern clients. One example is rate limiting. Your legacy service may not be able to handle internet-scale requests, or have a dependency on a downstream system that isn’t mean to get pummeled with traffic. You can apply request caching and rate limiting to prevent clients from burying the legacy app.

    First off, I built a classic ASP.NET Web Service. I hoped to never use SOAP again, but I’m dedicated to my craft.

    I did a “cf push” to my Pivotal Application Service environment and deployed two instances of the app to a Windows environment. In a few seconds, I had a publicly-accessible endpoint.

    Then it was back to my Gateway configuration. To do rate limiting, you need a way to identify callers. You know, some way to say that client X has exceeded their limit. Out of the box, there’s a rate limiter that uses Redis to store information about clients. That means I need a Redis instance. The simplest answer is “Docker”, so I ran a simple command to get Redis running locally (docker run --name my-redis -d -p 6379:6379 redis).

    I also needed a way to identify the caller. Here, I finally had to write some code. Specifically, this rate limiter filter expects a “key resolver.” I don’t see a way to declare one via configuration, so I opened the .java file in my project and added a Bean declaration that pulls a query parameter named “user.” That’s not enterprise ready (as you’d probably pull source IP, or something from a header), but this’ll do.

    @SpringBootApplication
    public class CloudGatewayDemo1Application {
    
      public static void main(String[] args) {	 
       SpringApplication.run(CloudGatewayDemo1Application.class, args);
      }
    	
      @Bean
      KeyResolver userKeyResolver() {
        return exchange -> 
       Mono.just(exchange.getRequest().getQueryParams().getFirst("user"));
      }
    }
    

    All that was left was my configuration. Besides adding rate limiting, I also wanted to to shield the caller from setting all those gnarly SOAP-related headings, so I added filters for that too.

    spring:
      cloud:
        gateway:
          routes:
          # doing weighted routing between two sites
          - id: test1
            ...
            
          # adding a header to an Azure Function request
          - id: test3
            ...
            
          # introducing rate limiting for ASP.NET Web Service
          - id: test4
            uri: https://aspnet-web-service.apps.pcfone.io
            predicates:
            - Path=/dotnet
            filters:
            - name: RequestRateLimiter
              args:
                key-resolver: "#{@userKeyResolver}"
                redis-rate-limiter.replenishRate: 1
                redis-rate-limiter.burstCapacity: 1
            - SetPath=/MyService.asmx
            - SetRequestHeader=SOAPAction, http://pivotal.io/SayHi
            - SetRequestHeader=Content-Type, text/xml
            - SetRequestHeader=Accept, text/xml
    

    Here, I set the replenish rate, which is how many request per second per user, and burst capacity, which is the max number of requests in a single second. And I set the key resolver to that custom bean that reads the “user” querystring parameter. Finally, notice the three request headers.

    I once again started up the Spring Cloud Gateway, and send a SOAP payload (no extra headers) to the localhost:8080/dotnet endpoint.

    A single call returned the expected response. If I rapidly submitted requests in, I saw an HTTP 429 response.

    So almost zero code to do some fairly sophisticated things with my gateway. None of those things involved a Java microservice, although obviously, Spring Cloud Gateway does some very nice things for Spring Boot apps.

    I like this trend of microservices-machinery-as-code where I can test and deploy middleware the same way I do custom apps. The more things we can reliably deliver via automation, the more bottlenecks we can remove.

  • Wait, THAT runs on Pivotal Cloud Foundry? Part 2 – TCP-routable services

    Wait, THAT runs on Pivotal Cloud Foundry? Part 2 – TCP-routable services

    Platform-as-a-Service products typically run web apps. That is, apps that accept HTTP traffic and listen on ports 80, 8080 or 443. As you survey the landscape today, you’ll find that’s still the case in the most popular public cloud application runtimes. That’s not a bad thing, but sometimes you have workloads with different routing needs. In this post, I’m going to demonstrate TCP Routing in Pivotal Cloud Foundry (PCF), and show Redis running directly in the platform.

    As a reminder, this is the 2nd post in a series about “unexpected” workloads running on PCF.

    About TCP Routing in PCF

    TCP Routing has been part of Cloud Foundry for two years now. Basically, TCP Routing lets your app handle traffic over non-HTTP TCP protocols. This is valuable for custom-built apps or packaged software that communicate with binary payloads or specialized transports.

    By default, custom-built apps are set to always listen on port 8080 in Cloud Foundry. The buildpack process (mentioned in part 1 of the series) configures that, although you can change this behavior. Even if your app does listen on port 8080, TCP Routing makes it easy to expose a non-HTTP port to the outside world via network address translation.

    Source: https://docs.cloudfoundry.org/adminguide/enabling-tcp-routing.html

    Assuming your Cloud Foundry admins configured TCP Routing in your environment(s), you can set up this type of per-app routing entirely via self-service.

    Deploying a TCP routable workload

    Instead of demonstrating with an app I wrote myself, I thought it’d be more fun to deploy a well-known software product. Enter Redis! Redis is a wildly-popular key-value store, and there are many ways to install it. One of the easiest options is the Docker image. Note that Redis typically exposes access over port 6379. When deploying Docker images to Cloud Foundry, the port defined in the EXPOSE directive is what’s actually exposed by Cloud Foundry app container. I didn’t know that until this week!

    After logging into my PCF environment, I ran the cf domains command to see what routable domains were available to me.

    I’ve got the “standard” domain for my regular web apps (here, apps.pcfone.io), a domain for TCP routing (tcp.apps.pcfone.io) and one for private traffic (apps.internal) that we’ll mess with shortly.

    I started by pushing a Redis image to PCF. I’m purposely using the –no-route command to ensure it doesn’t get a default web route in the apps.pcfone.io domain.

    cf push redisdocker --docker-image redis -i 1 -m 256M --no-route -u process

    After about ten seconds, the container is up and running. Notice however, that it’s currently not routable.

    Let’s change that. Now, because all apps sit behind the same edge router and TCP routes don’t have a path component, I can’t have two apps listening on the same TCP port. So, there’s a good chance that the default Redis port fo 6379 is already in use somewhere. That’s cool; we can tell PCF to assign a random port at the edge route that forwards traffic to port 6379 on the app container.

    cf map-route redisdocker tcp.apps.pcfone.io --random-port

    The result? I get a TCP route assigned on port 10011.

    Again, note that the app container is still listening on 6379, because that’s what was set by the Docker image at deploy time. But through network address translation, the external facing port is a different value. Let’s prove that Redis is actually running and addressable.

    I spun up the redis-cli and issued a command.

    Ok, clearly it’s reachable via the public Internet over a non-HTTP connection. That’s neat. I did a LITTLE more with Redis than that, by also adding and retrieving a key.

    With this pattern, my apps running in PCF (or anywhere) can send requests to PCF-hosted software that handles all kinds of payloads and protocols. But what if you don’t want these workloads to be Internet accessible?

    Setting up private TCP routing

    The above demo is cool, but you might not like having your cache, MQTT bus, or whatever, exposed to public traffic. This is where the relatively-new container-to-container networking is pretty darn neat.

    By default, app instances in Cloud Foundry talk to each other through the shared router. That’s not awful, but for performance reasons, or to access private services, you may want to communicate directly with another app container. With polyglot service discovery now part of PCF, it’s easy to do this via DNS, versus hard-coded container addresses. Let me show you.

    First, I removed the publicly-accessible TCP route from my Redis instance.

    Now, you can no longer reach it. Next up, I wanted to map my Redis instance to the apps.internal domain that’s ONLY accessible within a Cloud Foundry.

    cf map-route redisdocker apps.internal --hostname redisdocker

    Because we’re not dealing with any extra NAT action, I can directly hit Redis on port 6379. I built a Node.js app that connects to Redis, adds a key, and reads a key. I set the connection details to the internal domain and standard port.

    var options = {  host: "redisdocker.apps.internal",  port: 6379}
    var redis = require("redis"), client = redis.createClient(options);

    Then I pushed this app to PCF with a –no-start command so that I could set up connectivity between my app and Redis. Apps can’t automatically reach other apps on the apps.internal domain unless we give permission. It’s easy to do.  Via the Cloud Foundry CLI, I can create, delete, and list network policies. A network policy determines which apps can directly talk to each other (without going through the router), over which port and protocol.

    cf add-network-policy demo-app --destination-app redisdocker --protocol tcp --port 6379

    Notice that in that command, all I said was that one app (demo-app) could talk to another app (redisdocker). I didn’t have to map IP addresses, or anything like that. As app instances scale in and out, there’s no need to change the policies to reflect that. That’s a considerate UX.

    After executing the above command, my Node.js app (demo-app) could “see” the redisdocker app instance. And notice that I’ve allowed traffic to the default Redis port, 6379.

    With that policy in place, I loaded the Node.js app, and it directly routed requests over port 6379 to my Redis instance.

    Unlike most PaaS-like products, PCF offers TCP routing over non-HTTP channels. While you may still (wisely) choose to run certain workloads—clustered services, apps that need multiple IPs exposed per container, or workloads with complex persistence needs—in an environment outside of PCF, it’s useful to know that you can leverage PCF to host and orchestrate a wide variety of publicly or privately routable workloads. Keep an eye out tomorrow for the next post, where we investigate batch jobs.

  • Wait, THAT runs on Pivotal Cloud Foundry? Part 1 – Docker images

    Wait, THAT runs on Pivotal Cloud Foundry? Part 1 – Docker images

    When I say “PaaS” what comes to mind? If you’re like most people I talk to, you think of public cloud platforms for modern web apps. So I’ll forgive you if you didn’t realize that things are different now!

    The first generation of PaaS products had a few things in common. They were public cloud only. You had to build apps with the runtime constraints in mind. They only ran statelesss web apps. Linux was the only runtime. When Cloud Foundry first came out, it checked most of those boxes. But over the years, Pivotal Cloud Foundry (PCF) evolved to do much more.

    Many people still think of those first-generation PaaS constraints when considering PCF, and specifically, the Pivotal Application Service (PAS). So, I thought it’d be fun to look at non-traditional workloads. In this brief five-part series, I’m going to show off the following scenarios:

    Deploying and running Docker images

    Most Cloud Foundry users depend on buildpacks. Developers push source code, and the buildpack pulls in dependencies, frameworks, and runtimes, then builds a tarball that’s deployed as an OCI-compatible container in Cloud Foundry.  One major benefit of the buildpacks model is that the platform brings the root file system to your app. You’re not responsible for finding secure base images or maintaining that “layer” of the stack. But all that said, some folks like using Docker images as their packaging unit whether manually created (don’t do that) or as the output from a continuous integration pipeline.

    It doesn’t matter if Cloud Foundry builds the container or you send in a Docker image, it’s all treated the same by the platform. At runtime, the orchestrator executes all containers using runC, the same spec used by Docker and Kubernetes. Let’s see this in action.

    You can try this for free on Pivotal Web Services if you don’t have a Cloud Foundry available. I’m using a different environment, but they all behave the same. That’s the point! After you cf login to Cloud Foundry, it’s time to push a container.

    How about we start with a Node.js web app. Here’s an Express app built by the folks at Bitnami. We can actually push this to Cloud Foundry with a single command.

    cf push nodedocker --docker-image bitnami/node-example:0.0.1 -i 2 -m 128M

    In that command, notice a couple things. First, I’m using the –docker-image flag. Since I’m hitting a public image in the public Docker Hub, no credentials or anything are needed. PCF also works with private images, and private registries. Otherwise, it’s a standard command that asks for a single instance, and 128M of memory for each instance. Within ten seconds, you’ll have two routable instances ready to process traffic.

    Seriously. That’s amazing. And PCF doesn’t “mess with” the image. Whatever layers are in your Docker image are what run in Cloud Foundry. One thing PCF *does* do is volume mount a directory that contains a unique certificate for the container. This regularly-rotated credential (up to hourly!) is used for things like mTLS. You can see it by SSH-ing into the container and doing printenv or browsing the file system. Yes, you can actually SSH into containers whether built by the platform or via Docker images. No black boxes here.

    Deploying an app’s only half the story. Does PCF treat the running app the same way if it was packaged as a Docker image? Yup. Jumping to the PCF Apps Manager UX, you see our running app.

    If you look closely, you see that we indicate the app type, in this case, that it’s from a Docker image.

    More importantly, the platform bestows all the operational goodness on this app as any other. For example, all the logs from each app instance are collected and aggregated.

    You can add environment variables. Configure auto-scaling. Monitor app and container health metrics. Bind to marketplace services. All the things that make PCF a great runtime for apps make it a great runtime for apps packaged as Docker images.

    So try it out yourself. If you’re building custom apps, PCF is a great destination regardless of how you want to ship code. Stay tuned tomorrow for fun network routing demonstration.

  • My latest Pluralsight course—Architecting for High Availability in Microsoft Azure—is out!

    Imagine that someone asks you to build a cloud-hosted app. So far so good. And that app should be resilient against any glitches within the data center. Um, ok. And the app should stay online even if a whole region goes offline. Wait, what? While public clouds make it easier to build highly available systems, it’s not automatic. How do you set it up? What’s your responsibility, and what does the cloud provider do for you? I answer this, and more, in my new Pluralsight course: Architecting for High Availability in Microsoft Azure.

    This course is a four hour tour through the core Azure services, and how to configure each for high availability. Along the way, we discuss general resilience patterns. To prove how things work, we also build out a reference app that shows how everything works. At the end of the course, you’ll have a good idea of how to use Azure, and configure it effectively.

    2018-05-18-pluralsight

    The six course modules are:

    Patterns for High Availability in the Cloud. Here we discuss some core ideas around highly available distributed systems, and patterns you should know.

    Provisioning Durable Azure Storage. In this module, we check out Azure Storage and how Blob, File, and Disk storage works.

    Configuring Resilient Azure Databases. Databases can be a vulnerable part of your architecture, so you need to pay special attention here. We’ll look at Azure SQL Database, Cosmos DB, Redis Cache, and more.

    Deploying Redundant Azure Compute. This is arguably what cloud was first famous for, and here we’ll play around with Azure Virtual Machines, Azure App Service, and Azure Functions.

    Scale Processing via Azure Integration Capabilities. Messaging is so hot right now! A bulletproof integration tier is critical, so we’ll dig into how to set up Azure Service Bus, Azure Event Hubs, and Azure Logic Apps for resilience.

    Configuring Uninterrupted Traffic with Azure Networking. If your assets aren’t routable, it doesn’t matter how resilient they are! In this module, we explore Azure networking services like Virtual Networks, Load Balancing, App Gateway, and Traffic Manager.

    I hope you watch this course and enjoy it. It took me months to put together, but the final result should be worth it!

  • Introducing cloud-native integration (and why you should care!)

    Introducing cloud-native integration (and why you should care!)

    I’ve got three kids now. Trying to get anywhere on time involves heroics. My son is almost ten years old and he’s rarely the problem. The bottleneck is elsewhere. It doesn’t matter how much faster my son gets himself ready, it won’t improve my family’s overall speed at getting out the door. The Theory of Constraints says that you improve the throughput of your process by finding and managing the bottleneck, or constraint. Optimizing areas outside the constraint (e.g. my son getting ready even faster) don’t make much of a difference. Does this relate to software, and application integration specifically? You betcha.

    Software delivery goes through a pipeline. Getting from “idea” to “production” requires a series of steps. And then you repeat it over and over for each software update. How fast you get through that process dictates how responsive you can be to customers and business changes. Your development team may operate LIKE A MACHINE and crank out epic amounts of code. But if your dedicated ops team takes forever to deploy it, then it just doesn’t matter how fast your devs are. Inventory builds up, value is lost. My assertion is that the app integration stage of the pipeline is becoming a bottleneck. And without making changes to how you do integration, your cloud-native efforts are going to waste.

    What’s “cloud native” all about? At this month’s Integrate conference, I had the pleasure of talking about it. Cloud-native refers to how software is delivered, not where. Cloud-native systems are built for scale, built for continuous change, and built to tolerate failure. Traditional enterprises can become cloud natives, but only if they make serious adjustments to how they deliver software.

    Even if you’ve adjusted how you deliver code, I’d suspect that your data, security, and integration practices haven’t caught up. In my talk, I explained six characteristics of a cloud-native integration environment, and mixed in a few demos (highlighted below) to prove my points.

    #1 – Cloud-native integration is more composable

    By composable, I mean capable of assembling components into something greater. Contrast this to classic integration solutions where all the logic gets embedded into a single artifact. Think ETL workflows where ever step of the process is in one deployable piece. Need to change one component? Redeploy the whole thing. One step require a ton of CPU processing? Find a monster box to host the process in.

    A cloud-native integration gets built by assembling independent components. Upgrade and scale each piece independently. To demonstrate this, I built a series of Microsoft Logic Apps. Two of them take in data. The first takes in a batch file from Microsoft OneDrive, the other takes in real-time HTTP requests. Both drop the results to a queue for later processing.

    2017.07.10-integrate-01

    The “main” Logic App takes in order entries, enriches the order via a REST service I have running in Azure App Service, calls an Azure Function to assign a fraud score, and finally dumps the results to a queue for others to grab.

    2017.07.10-integrate-02

    My REST API sitting in Azure App Service is connected to a GitHub repo. This means that I should be able to upgrade that individual service, without touching the data pipeline sitting Logic Apps. So that’s what I did. I sent in a steady stream of requests, modified my API code, pushed the change to GitHub, and within a few seconds, the Logic App is emitting out a slightly different payload.

    2017.07.10-integrate-03

    #2 – Cloud-native integration is more “always on”

    One of the best things about early cloud platforms being less than 100% reliable was that it forced us to build for failure. Instead of assuming the infrastructure was magically infallible, we built systems that ASSUMED failure, and architected accordingly.

    For integration solutions, have we really done the same? Can we tolerate hardware failure, perform software upgrades, or absorb downstream dependency hiccups without stumbling? A cloud-native integration solution can handle a steady load of traffic while staying online under all circumstances.

    #3 – Cloud-native integration is built for scale

    Elasticity is a key attribute of cloud. Don’t build out infrastructure for peak usage; build for easy scale when demand dictates. I haven’t seen too many ESB or ETL solutions that transparently scale, on-demand with no special considerations. No, in most cases, scaling is a carefully designed part of an integration platform’s lifecycle. It shouldn’t be.

    If you want cloud-native integration, you’ll look to solutions that support rapid scale (in, or out), and let you scale individual pieces. Event ingestions unexpected and overwhelming? Scale that, and that alone. You’ll also want to avoid too much shared capacity, as that creates unexpected coupling and makes scaling the environment more difficult.

    #4 – Cloud-native integration is more self-service

    The future is clear: there will be more “citizen integrators” who don’t need specialized training to connect stuff. IFTTT is popular, as are a whole new set of iPaaS products that make it simple to connect apps. Sure, they aren’t crazy sophisticated integrations; there will always be a need for specialists there. But integration matters more than ever, and we need to democratize the ability to connect our stuff.

    One example I gave here was Pivotal Cloud Cache and Pivotal GemFire. Pivotal GemFire is an industry-leading in-memory data grid. Awesome tech, but not trivial to properly setup and use. So, Pivotal created an opinionated slice of GemFire with a subset of features, but an easier on-ramp. Pivotal Cloud Cache supports specific use cases, and an easy self-service provisioning experience. My challenge to the Integrate conference audience? Why couldn’t we create a simple facade for something powerful, but intimidating, like Microsoft BizTalk Server? What if you wanted a self-service way to let devs create simple integrations? I decided use the brand new Management REST API from BizTalk Server 2016 Feature Pack 1 to build one.

    I used the incomparable Spring Boot to build a Java app that consumed those REST APIs. This app makes it simple to create a “pipe” that uses BizTalk’s durable bus to link endpoints.

    2017.07.10-integrate-05

    I built a bunch of Java classes to represent BizTalk objects, and then created the required API payloads.

    2017.07.10-integrate-04

    The result? Devs can create a new pipe that takes in data via HTTP and drops the result to two file locations.

    2017.07.10-integrate-06

    When I click the button above, I use those REST APIs to create a new in-process HTTP receive location, two send ports, and the appropriate subscriptions.

    2017.07.10-integrate-07

    Fun stuff. This seems like one way you could unlock new value in your ESB, while giving it a more cloud-native UX.

    #5 – Cloud-native integration supports more endpoints

    There’s no turning back. Your hippest integration offered to enterprise devs CANNOT be SharePoint. Nope. Your teams want to creatively connect to Slack, PagerDuty, Salesforce, Workday, Jira, and yes, enterprisey things like SQL Server and IBM DB2.

    These endpoints may be punishing your integration platform with a constant data stream, or, process data irregularly, in bulk. Doing newish patterns like Event Sourcing? Your apps will talk to an integration platform that offers a distributed commit log. Are you ready? Be ready for new endpoints, with new data streams, consumed via new patterns.

    #6 – Cloud-native integration demands complete automation

    Are you lovingly creating hand-crafted production servers? Stop that. And devs should have complete replicas of production environments, on their desktop. That means packaging and automating the integration bus too. Cloud-natives love automation!

    Testing and deploying integration apps must be automated. Without automated tests, you’ll never achieve continuous delivery of your whole system. Additionally, if you have to log into one of your integration servers, you’re doing it wrong. All management (e.g. monitoring, deployments, upgrades) should be done via remote tools and scripts. Think fleets of servers, not long-lived named instances.

    To demonstrate this concept, I discussed automating the lifecycle of your integration dependency. Specifically, through the use of a service broker. Initially part of Cloud Foundry, the service broker API has caught on elsewhere. A broad set of companies are now rallying around a single API for advertising services, provisioning, de-provisioning, and more. Microsoft built a Cloud Foundry service broker, and it handles lots of good things. It handles lifecycle and credential sharing for services like Azure SQL Database, Azure Service Bus, Azure CosmosDB, and more. I installed this broker into my Pivotal Web Services account, and it advertised available services.

    2017.07.10-integrate-08

    Simply by typing in cf create-service azure-servicebus standard integratesb -c service-bus-config.json I kicked off a fast, automated process to generate an Azure Resource Group and create a Service Bus namespace.

    2017.07.10-integrate-09

    Then, my app automatically gets access to environment variables that hold the credentials. No more embedding creds in code or config, no need to go to the Azure Portal. This makes integration easy, developer-friendly, and repeatable.

    2017.07.10-integrate-10

    Summary

    It’s such an exciting time to be a software developer. We’re solving new problems in new ways, and making life better for so many. The last thing we want is to be held back by a bottleneck in our process. Don’t let integration slow down your ambitions. The technology is there to help you build integration platforms that are more scalable, resilient, and friendly-to-change. Go for it!

  • Using Azure API Management with Cloud Foundry

    Using Azure API Management with Cloud Foundry

    APIs, APIs everywhere. They power our mobile apps, connect our “things”, and improve supply chains. API management suites popped up to help companies secure, tune, version, and share their APIs effectively. I’ve watched these suites expand beyond the initial service virtualization and policy definition capabilities to, in some cases, replace the need for an ESB. One such suite is Azure API Management. I decided to take Azure API Management for a spin, and use it with a web service running in Cloud Foundry.

    Cloud Foundry is an ideal platform for running modern apps, and it recently added a capability (“Route Services“) that lets you inject another service into the request path. Why is this handy? I could use this feature to transparently introduce a caching service, a logging service, an authorization service, or … an API gateway. Thanks to Azure API Management, I can add all sorts of functionality to my API, without touching the code. Specifically, I’m going to try and add response caching, rate limiting, and IP address filtering to my API.

    2017-01-16-cf-azureapi-01

    Step 1 – Deploy the web service

    I put together a basic Node.js app that serves up “startup ideas.” If you send an HTTP GET request to the root URL, you get all the ideas back. If you GET a path (“/startupideas/1”) you get a specific idea. Nothing earth-shattering.

    Next up, deploying my app to Cloud Foundry. If your company cares about shipping software, you’re probably already running Pivotal Cloud Foundry somewhere. If not, no worries. Nobody’s perfect. You can try it out for free on Pivotal Web Services, or by downloading a fully-encapsulated VM.

    Note: For production scenarios, you’d want your API gateway right next to your web services. So if you want to use Cloud Foundry with Azure API Management, you’ll want to run apps in Pivotal Cloud Foundry on Azure!

    The Cloud Foundry CLI is a super-powerful tool, and makes it easy to deploy an app—Java, .NET, Node.js, whatever. So, I typed in “cf push” and watched Cloud Foundry do it’s magic.

    2017-01-16-cf-azureapi-02

    In a few seconds, my app was accessible. I sent in a request, and got back a JSON response along with a few standard HTTP headers.

    2017-01-16-cf-azureapi-03

    At this point, I had a fully working service deployed, but was in dire need of API management.

    Step 2 – Create an instance of Azure API Management

    Next up, I set up an instance of Azure API Management. From within the Azure Portal, I found it under the “Web + Mobile” category.

    2017-01-16-cf-azureapi-04

    After filling in all the required fields and clicking “create”, I waited about 15 minutes for my instance to come alive.

    2017-01-16-cf-azureapi-05

    Step 3 – Configure API in Azure API Management

    The Azure API Management product is meant to help companies create and manage their APIs. There’s a Publisher Portal experience for defining the API and managing user subscriptions, and a Developer Portal targeted at devs who consume APIs. Both portals are basic looking, but the Publisher Portal is fairly full-featured. That’s where I started.

    Within the Publisher Portal, I defined a new “Product.” A product holds one or more APIs and has settings that control who can view and subscribe to those APIs. By default, developers who want to use APIs have to provide a subscription token in their API calls. I don’t feel like requiring that, so I unchecked the “require subscription” box.

    2017-01-16-cf-azureapi-06

    With a product in place, I added an API record. I pointed to the URL of my service in Cloud Foundry, but honestly, it didn’t matter. I’ll be overwriting it later at runtime.

    2017-01-16-cf-azureapi-07

    In Azure API Management, you can call out each API operation (URL + HTTP verb) separately. For a given operation, you have the choice of specifying unique behaviors (e.g. caching). For a RESTful service, the operations could be represented by a mix of HTTP verbs and extension of the URL path. That is, one operation might be to GET “/customers” and another could GET “/customers/100/orders.”

    2017-01-16-cf-azureapi-08

    In the case of Route Services, the request is forwarded by Cloud Foundry to Azure API Management without any path information. It redirects all requests to the root URL in Azure API Management and puts the full destination URL in an HTTP header (“x-cf-forwarded-url”). What does that mean? It means that I need to define a single operation in Azure API Management, and use policies to add different behaviors for each operation represented by unique paths.

    Step 4 – Create API policy

    Now, the fun stuff! Azure API Management has a rich set of management policies that we use to define our API’s behavior. As mentioned earlier, I wanted to add three behaviors: caching, IP address filtering, and rate limited. And for fun, I also wanted to add an output HTTP header to prove that traffic flowed through the API gateway.

    You can create policies for the whole product, the API, or the individual operation. Or all three! The policy that Azure API Management ends up using for your API is a composite of all applicable policies. I started by defining my scope at the operation level.

    2017-01-16-cf-azureapi-09

    Below is my full policy. What should you pay attention to? On line 10, notice that I set the target URL to whatever Cloud Foundry put into the x-cf-forwarded-url header. On lines 15-18, I do IP filtering to keep a particular source IP from calling the service. See on line 23 that I’m rate limiting requests to the root URL (all ideas) only. Lines 25-28 spell out the request caching policy. Finally, on line 59 I define the cache expiration period.

    <policies>
      <!-- inbound steps apply to inbound requests -->
      <inbound>
        <!-- variable is "true" if request into Cloud Foundry includes /startupideas path -->
        <set-variable name="isStartUpIdea" value="@(context.Request.Headers["x-cf-forwarded-url"].Last().Contains("/startupideas"))" />
        <choose>
          <!-- make sure Cloud Foundry header exists -->
          <when condition="@(context.Request.Headers["x-cf-forwarded-url"] != null)">
            <!-- rewrite the target URL to whatever comes in from Cloud Foundry -->
            <set-backend-service base-url="@(context.Request.Headers["x-cf-forwarded-url"][0])" />
            <choose>
              <!-- applies if request is for /startupideas/[number] requests -->
              <when condition="@(context.Variables.GetValueOrDefault<bool>("isStartUpIdea"))">
                <!-- don't al low direct calls from a particular IP -->
                <ip-filter action="forbid">
    <address>63.234.174.122</address>
    
                </ip-filter>
              </when>
              <!-- applies if request is for the root, and returns all startup ideas -->
              <otherwise>
                <!-- limit callers by IP to 10 requests every sixty seconds -->
                <rate-limit-by-key calls="10" renewal-period="60" counter-key="@(context.Request.IpAddress)" />
                <!-- lookup requests from the cache and only call Cloud Foundry if nothing in cache -->
                <cache-lookup vary-by-developer="false" vary-by-developer-groups="false" downstream-caching-type="none" must-revalidate="false">
                  <vary-by-header>Accept</vary-by-header>
                  <vary-by-header>Accept-Charset</vary-by-header>
                </cache-lookup>
              </otherwise>
            </choose>
          </when>
        </choose>
      </inbound>
      <backend>
        <base />
      </backend>
      <!-- output steps apply to after Cloud Foundry reeturns a response -->
      <outbound>
        <!-- variables hold text to put into the custom outbound HTTP header -->
        <set-variable name="isroot" value="returning all results" />
        <set-variable name="isoneresult" value="returning one startup idea" />
        <choose>
          <when condition="@(context.Variables.GetValueOrDefault<bool>("isStartUpIdea"))">
            <set-header name="GatewayHeader" exists-action="override">
              <value>@(
            	   (string)context.Variables["isoneresult"]
            	  )
              </value>
            </set-header>
          </when>
          <otherwise>
            <set-header name="GatewayHeader" exists-action="override">
              <value>@(
                   (string)context.Variables["isroot"]
                  )
              </value>
            </set-header>
            <!-- set cache to expire after 10 minutes -->
            <cache-store duration="600" />
          </otherwise>
        </choose>
      </outbound>
      <on-error>
        <base />
      </on-error>
    </policies>
    

    Step 5 – Add Azure API Management to the Cloud Foundry route

    At this stage, I had my working Node.js service in Cloud Foundry, and a set of policies configured in Azure API Management. Next up, joining the two!

    The Cloud Foundry service marketplace makes it easy for devs to add all sorts of services to an app—databases, caches, queues, and much more. In this case, I wanted to add a user-provided service for Azure API Management to the catalog. It just took one command:

    cf create-user-provided-service azureapimgmt -r https://seroterpivotal.azure-api.net

    All that was left to do was bind my particular app’s route to this user-provided service. That also takes one command:

    cf bind-route-service cfapps.io azureapimgmt –hostname seroter-startupideas

    With this in place, Azure API Management was invisible to the API caller. The caller only sends requests to the Cloud Foundry URL, and the Route Service intercepts the request!

    Step 6 – Test the service

    Did it work?

    When I sent an HTTP GET request to https://seroter-startupideas.cfapps.io/startupideas/1 I saw a new HTTP header in the result.

    2017-01-16-cf-azureapi-10

    Ok, so it definitely went through Azure API Management. Next I tried the root URL that has policies for caching and rate limiting.

    On the first call to the root URL, I saw an log entry recorded in Cloud Foundry, and a JSON response with the latest timestamp.

    2017-01-16-cf-azureapi-11

    With each subsequent request, the timestamp didn’t change, and there was no entry in the Cloud Foundry logs. What did that mean? It meant that Azure API Management cached the initial response and didn’t send future requests back to Cloud Foundry. Rad!

    The last test was for rate limiting. It didn’t matter how many requests I sent to https://seroter-startupideas.cfapps.io/startupideas/1 I always got a result. No surprise, as there was no rate limiting for that operation. However, when I sent a flurry of requests to https://seroter-startupideas.cfapps.io I got back the following response:

    2017-01-16-cf-azureapi-12

    Very cool. With zero code changes, I added caching and rate-limiting to my Node.js service.

    Next Steps

    Azure API Management is pretty solid. There are lots of great tools in the API Gateway market, but if you’re running apps in Microsoft Azure, you should strongly consider this one. I only scratched the service of the capabilities here, and I plan to spend some more time investigating user subscription and authentication capabilities.

    Have you used Azure API Management? Do you like it?

  • Using Multiple NoSQL Database Models with Orchestrate and Node.js

    Databases aren’t a solved problem. Dozens of new options have sprouted up over the past five years as developers look for ways to effectively handle emerging application patterns. But how do you choose which one to use, especially when your data demands might span the competencies of an individual database engine?

    NoSQL choices abound. Do you need something that stores key-value information for quick access? How about stashing JSON documents that represent fluid data structures? What should you do for Internet-of-Things scenarios or fast moving log data where “time” is a first class citizen? How should you handle dynamic relationships that require a social graph approach? Where should you store and use geo-spatial data? And don’t forget about the need to search all that data! If you need all of the aforementioned characteristics, then you typically need to stand up and independently manage multiple database technologies and weave them together at the app layer. Orchestrate.io does it differently, and yesterday, CenturyLink acquired them.

    What does Orchestrate do? It’s a fast, hosted, managed, multi-model database fabric that is accessible through a single REST API. Developers only pay for API calls, and have access to a flexible key-value store that works with time-ordered events, geospatial data, and graph relationships. It runs an impressive tech stack under the covers, but all that the developers have to deal with is the web interface and API layer. In this blog post, I’ll walk through a simple sample app that I built in Node.js.

    First off, go sign up for an Orchestrate account that comes with a nice free tier. Do it, now, I’ll wait.

    Once in the Orchestrate management dashboard, I created an application. This is really just a container for data collections for a given deployment region. In my case, I chose one of the four brand new CenturyLink regions that we lit up last night. Psst, it’s faster on CenturyLink Cloud than on AWS.

    2015.04.21orchestrate01

    For a given app, I get an API key used to authenticate myself in code.  Let’s get to work (note that you can find my full project in this GitHub repo). I built a Node.js app, but you can use any one of their SDKs (Node, Ruby, Python, Java and Go with community-built options for .NET and PHP) or, their native API. To use the Node SDK, I added the package via npm.

    2015.04.21orchestrate02

    In this app, I’ll store basketball player profiles, relationships between players, and a time-ordered game log. I spun up a Node Express project (using Visual Studio, which I’m getting used to), and added some code to “warm up” my collection by adding some records, some event data, and some relationships. You can also query/add/update/delete via the Orchestrate management dashboard, but this was a more repeatable choice.

    var express = require('express');
    var router = express.Router();
    
    //Orchestrate API token
    var token = "<key>";
    var orchestrate = require('orchestrate');
    //location reference
    orchestrate.ApiEndPoint = "<endpoint>";
    var db = orchestrate(token);
    
    /* Warmup the collection. */
    router.get('/', function (req, res) {
    
        //create key/value records
        db.put('Players', "10001", {
            "name": "Blake Griffin",
            "team": "Los Angeles Clippers",
            "position": "power forward",
            "birthdate": "03/16/89",
            "college": "Oklahoma",
            "careerppg": "21.5",
            "careerrpg": "9.7"
        })
        .then(function (result1) {
            console.log("record added");
        });
    
        //create key/value records
        db.put('Players', "10002", {
            "name": "DeAndre Jordan",
            "team": "Los Angeles Clippers",
            "position": "center",
            "birthdate": "07/21/88",
            "college": "Texas A&M",
            "careerppg": "8.0",
            "careerrpg": "9.0"
        })
        .then(function (result2) {
            console.log("record added");
        });
    
        //create key/value records
        db.put('Players', "10003", {
            "name": "Matt Barnes",
            "team": "Los Angeles Clippers",
            "position": "strong forward",
            "birthdate": "03/09/80",
            "college": "UCLA",
            "careerppg": "8.1",
            "careerrpg": "4.5",
            "teams": [
                "Los Angeles Clippers",
                "Sacramento Kings",
                "Golden State Warriors"
            ]
        })
        .then(function (result3) {
            console.log("record added");
        });
    
        //create event
        db.newEventBuilder()
        .from('Players', '10001')
        .type('gamelog')
        .time(1429531200)
        .data({ "opponent": "San Antonio Spurs", "minutes": "43", "points": "26", "rebounds": "12" })
        .create()
        .then(function (result4) {
            console.log("event added");
        });
    
        //create event
        db.newEventBuilder()
        .from('Players', '10001')
        .type('gamelog')
        .time(1429012800)
        .data({ "opponent": "Phoenix Suns", "minutes": "29", "points": "20", "rebounds": "8" })
        .create()
        .then(function (result5) {
            console.log("event added");
        });
    
        //create graph relationship
        db.newGraphBuilder()
        .create()
        .from('Players', '10001')
        .related('currentteammate')
        .to('Players', '10002')
        .then(function (result6) {
            console.log("graph item added");
        });
    
        //create graph relationship
        db.newGraphBuilder()
        .create()
        .from('Players', '10001')
        .related('currentteammate')
        .to('Players', '10003')
        .then(function (result7) {
            console.log("graph item added");
        });
    
        res.send('warmed up');
    });
    
    module.exports = router;
    

    After running the app and hitting the endpoint, I saw a new collection (“Players”) created in Orchestrate.

    2015.04.21orchestrate03

    It’s always nice to confirm that things worked, so I switched to the Orchestrate UI where I queried my key/value store for one of the keys I added above. Sure enough, the item for Los Angeles Clippers superstar Blake Griffin comes back. Success.

    2015.04.21orchestrate04

    Querying data items from code is super easy. Retrieve all the players in the collection? Couple lines of code.

    /* GET all player listing. */
    router.get('/', function (req, res) {
    
        db.list("Players")
        .then(function (result) {
            playerlist = result.body.results;
            //console.log(playerlist);
    
            res.render('players', { title: 'Players List', plist: playerlist });
        })
        .fail(function (err) {
            console.log(err);
        });
    });
    

    When the app runs, I get a list of players. Thanks to my Jade template, I’ve also got a hyperlink to the “details” page.

    2015.04.21orchestrate05

    The player details include their full record info, any relationships to other players, and a log of games played. As you can see in the code below, it’s extremely straightforward to pull each of these entity types.

    /* GET one player profile. */
    router.get('/:playerid', function (req, res) {
    
        console.log(req.params.playerid);
    
        //get player object
        db.get("Players", req.params.playerid)
        .then(function (result) {
            player = result.body;
            //console.log(player);
    
            //get graph of relationships
            db.newGraphReader()
            .get()
            .from('Players', req.params.playerid)
            .related('currentteammate')
            .then(function (relres) {
                playerlist = relres.body;
                //console.log(playerlist);
    
                //get time-series events
                db.newEventReader()
                .from('Players', req.params.playerid)
                .type('gamelog')
                .list()
                .then(function (evtres) {
                    gamelog = evtres.body;
                    //console.log(gamelog);
    
                    res.render('player', { title: 'Player Profile', profile: player, plist: playerlist, elist: gamelog });
                });
            });
        })
        .fail(function (err) {
            console.log(err);
        });
    });
    

    2015.04.21orchestrate06

    I didn’t bake in any true “search” capability into my app, but it’s one of the most powerful parts of the database service. Devs search through collections with a Lucene-powered engine with a robust set of operators. Do fuzzy search, deep full-text search of nested objects, grouping, proximity search, geo queries, aggregations, complex sorting, and more. Which player ever played for the Sacramento Kings? It’s easy to search nested objects.

    2015.04.21orchestrate07

    Summary

    I don’t usually flog my own company’s technology on this blog, but this is fun, important stuff. Developers are faced with a growing set of technologies they need to know in order to build efficient mobile experiences, data-intensive systems, and scalable cloud apps. Something like Orchestrate flips the script by giving developers a quick on-ramp to a suite of database engines that solve multiple problems.

    Take it for a spin, and give me feedback for where we should go with it next!

  • Node.js and Visual Studio: From Zero to a Cloud Foundry Deployment in 2 Minutes

    Node.js and Visual Studio: From Zero to a Cloud Foundry Deployment in 2 Minutes

    Microsoft just released the 1.0 version of their Node.js Tools for Visual Studio. This gives Windows developers a pretty great environment for building clean, feature rich Node.js applications. It’s easy to take an application built in Visual Studio and deploy to Microsoft’s own cloud, so how about pushing apps elsewhere? In this post, I’ll show you how quick and easy it is to set up a Node.js application in Visual Studio, and push to a Cloud Foundry endpoint.

    As a prerequisite, take 30 seconds to download and install the Cloud Foundry CLI, and sign up for a friendly Cloud Foundry provider. And, install the new Node.js Tools for Visual Studio.

    Creating and Deploying an Express Application

    Let’s start with the lightning round, and then I’ll go back and show off some of the features of this toolkit.

    Step 1 – Open Visual Studio and create the Node.js Express project (25 seconds)

    The Node.js Tools for Visual Studio add a few things to the Visual Studio experience. One of those is the option to select Node project types. This makes it super easy to spin up an example Express application.

    2015.03.27node01

    The sample project selected above includes a package.json file with all the dependencies. Visual Studio goes out and reconciles them all by downloading the packages via npm.

    2015.03.27node02

    The project loads up quickly, and you can see a standard Express skeleton project. Note that Visual Studio doesn’t throw any useless cruft into the solution. It’s all just basic Node stuff. That’s nice.

    2015.03.27node03


    Step 2 – Open Command Prompt and target the AppFog v2 environment (30 seconds)

    This Express app is boring, but technically a complete, deployable project. Let’s do that. I didn’t see an obvious way to get my Cloud Foundry-aware command line within the Visual Studio shell itself, but it’s crazy easy to open one that’s pointed at our project directory. Right-clicking the Visual Studio project gives the option to open a command prompt at the root of the project.

    2015.03.27node04

    Before deploying, I made sure I had the credentials and target API for my Cloud Foundry endpoint. In this case, I’m using the not-yet-released AppFog v2 from CenturyLink. “Sneak peek alert!”

    2015.03.27node05

    After logging into my endpoint via the Cloud Foundry CLI, I was ready to push the app.


    Step 3 – Push application (81 seconds)

    With a simple “cf push” command, I was off and running. App deployment times vary based on project size and complexity. If I had deleted (or excluded) all the local packages, then Cloud Foundry would have simply downloaded them all server-side, thus accelerating the upload. I was lazy, and just sent all my files up to the platform fabric directly.

    2015.03.27node11

    After a short time, my app is staged, deployed, and started.


    Step 4 – Verify!

    The best part of any demo: seeing the results!

    2015.03.27node06

    You don’t really need to know anything about Node (or Cloud Foundry!) to test this out. It’s never been easier to sample new technology.

    Exploring Additional Node Capabilities in Visual Studio

    Let’s retrace our steps a bit and see what else these Node tools put into Visual Studio. First, you’ll see a host of options when creating a new Visual Studio project. There are empty Node.js projects (that pretty much just include a package.json and app.js file), Express applications, and even Azure-flavored ones.

    2015.03.27node13

    The toolkit includes some Intellisense for Node.js developers which is nice. In the case below, it knows what methods are available on common object types.

    2015.03.27node10

    For installing packages, there are two main options. First, you can use the Node.js Interactive Window to issue commands. One such command is .npm and I can install anything from the global directory. Such as the awesome socket.io package.

    2015.03.27node11

    One downside of using this mechanism is that the package.json file isn’t automatically updated. However, Visual Studio helpfully reminds you of that.

    2015.03.27node12

    The “preferred” way to install packages seems to be the GUI where you can easily browse and select your chosen package. There’s options here to choose a version, pick a dependency type, and add to the package.json file. Pretty handy.

    2015.03.27node08

    The Toolkit also makes it easy to quickly spin up and debug an app. Press F5 starts up the Node server and opens a browser window that points at that server and relevant port.

    2015.03.27node09

    Summary

    I’ve used a few different Node.js development environments on Windows, and Visual Studio is quickly becoming a top-tier choice. If you’re just starting out with Node, or a seasoned developer, Visual Studio seems to have the nice mix of helpful capabilities while not getting in the way too much.