Category: Microsoft Azure

  • Looking to continuously test and patch container images? I’ll show you one way.

    Looking to continuously test and patch container images? I’ll show you one way.

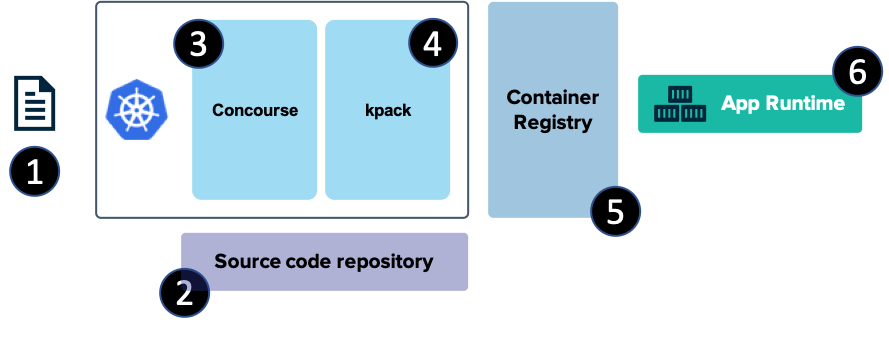
    A lot of you are packaging code into container images before shipping it off to production. That’s cool. For many, this isn’t a one-time exercise at the end of a project; it’s an ongoing exercise throughout the lifespan of your product. Last week in Barcelona, I did a presentation at VMworld Europe where I took a custom app, ran tests in a pipeline, containerized it, and pushed to a cloud runtime. I did all of this with fresh open-source technologies like Kubernetes, Concourse, and kpack. For this blog post, I’ll show you my setup, and for fun, take the resulting container image and deploy it, unchanged, to one Microsoft Azure service, and one Pivotal service.

    First off, containers. Let’s talk about them. The image that turns into running container is made up of a series of layers. This union of read-only layers gets mounted to present itself as a single filesystem. Many commands in your Dockerfile, generate a layer. When I pull the latest Redis image, and run a docker history command, I see all the layers:

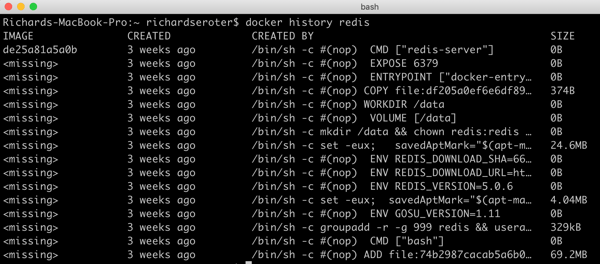
    Ok, Richard, we get it. Like onions and ogres, images have layers. I bring it up, because responsibly maintaining a container image means continually monitoring and updating those layers. For a custom app, that means updating layers that store app code, the web server, and the root file system. All the time. Ideally, I want a solution that automatically builds and patches all this stuff so that I don’t have to. Whatever pipeline to production you build should have that factored in!

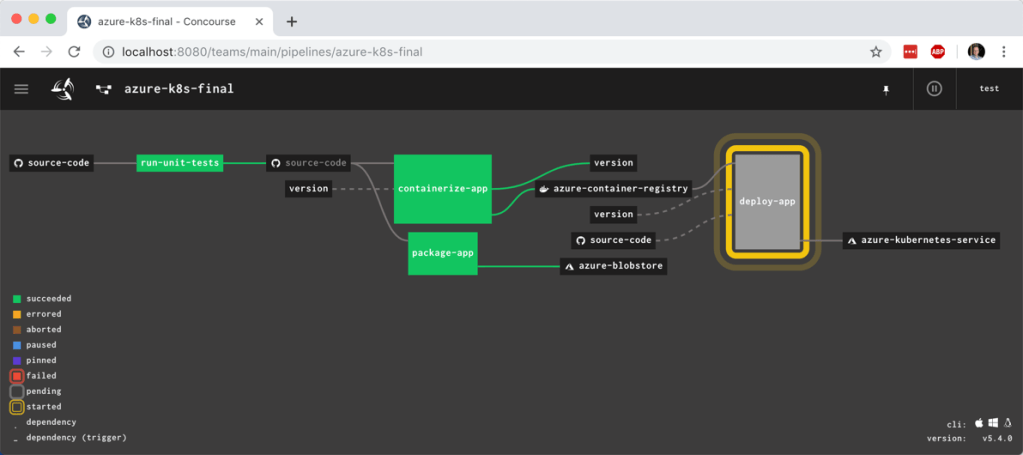
    Let’s get to it. Here’s what I built. After coding a Spring Boot app, I checked the code into a GitHub master branch. That triggered a Concourse pipeline (running in Kubernetes) that ran unit tests, and promoted the code to a “stable” branch if the tests passed. The container build service (using the kpack OSS project) monitored the stable branch, and built a container image which got stored in the Docker Hub. From there, I deployed the Docker image to a container-friendly application runtime. Easy!

    Step #1 – Build the app

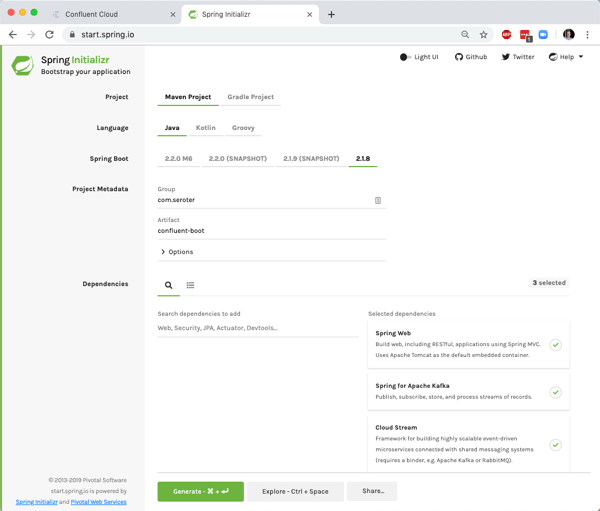
    The app is simple, and relatively inconsequential. Build a .NET app, Go app, Node.js app, whatever. I built a Spring Boot app using Spring Initializr. Click here to download the same scaffolding. This app will simply serve up a web endpoint, and also offer a health endpoint.

    In my code, I have a single RESTful endpoint that responds to GET requests at the root. It reads an environment variable (so that I can change it per runtime), and returns that in the response.

    @RestController
    public class GreetingController {
    	
      @Value("${appruntime:Spring Boot}")
      private String appruntime;
    	
      @GetMapping("/")
      public String SayHi() {
        return "Hello VMworld Europe! Greetings from " + appruntime;
      }
    }
    

    I also created a single JUnit test to check the response value from my RESTful service. I write great unit tests; don’t be jealous.

    @RunWith(SpringRunner.class)
    @SpringBootTest(webEnvironment = WebEnvironment.RANDOM_PORT)
    public class BootKpackDemoApplicationTests {
    
      @LocalServerPort
      private int port;
    	
      @Autowired
      private TestRestTemplate restTemplate;
    	
      @Test
      public void testEndpoint() {
        assertThat(this.restTemplate.getForObject("http://localhost:" + port + "/",
        String.class)).contains("Hello");
      }
    }
    

    After crafting this masterpiece, I committed it to a GitHub repo. Ideally, this is all a developer ever has to do in their job. Write code, test it, check it in, repeat. I don’t want to figure out the right Dockerfile format, configure infrastructure, or any other stuff. Just let me write code, and trigger a pipeline that gets my code securely to production, over and over again.

    Step #2 – Set up the CI pipeline

    For this example, I’m using minikube on my laptop to host the continuous integration software and container build service. I got my Kubernetes 1.15 cluster up (since Concourse currently works up to v 1.15) with this command:

    minikube start --memory=4096 --cpus=4 --vm-driver=hyperkit --kubernetes-version v1.15.0
    

    Since I wanted to install Concourse in Kubernetes via Helm, I needed Helm and tiller set up. I used a package manager to install Helm on my laptop. Then I ran three commands to generate a service account, bind a cluster role to that service account, and initialize Helm in the cluster.

    kubectl create serviceaccount -n kube-system tiller 
    kubectl create clusterrolebinding tiller-cluster-rule --clusterrole=cluster-admin --serviceaccount=kube-system:tiller 
    helm init --service-account tiller 
    

    With that business behind me, I could install Concourse. I talk a lot about Concourse, taught a Pluralsight course about it, and use it regularly. It’s such a powerful tool for continuous processing of code. To install into Kubernetes, it’s just a single reference to a Helm chart.

    helm install --name vmworld-concourse stable/concourse
    

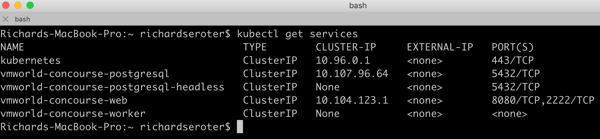
    After a few moments, I saw that I had pods created and services configured.

    The chart also printed out commands for how to do port forwarding to access the Concourse web console.

    export POD_NAME=$(kubectl get pods --namespace default -l "app=vmworld-concourse-web" -o jsonpath="{.items[0].metadata.name}")
     echo "Visit http://127.0.0.1:8080 to use Concourse"
     kubectl port-forward --namespace default $POD_NAME 8080:8080
    

    After running those commands, I pinged the localhost URL and saw the dashboard.

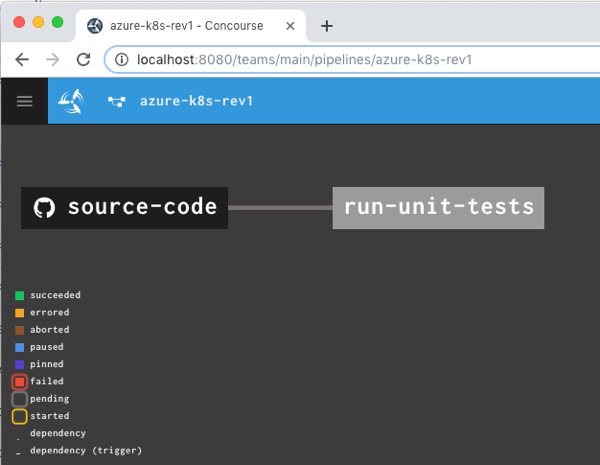
    All that was left was the actual pipeline. Concourse pipelines are defined in YAML. My GitHub repo has two branches (master and stable), so I declared “resources” for both. Since I have to write to the stable branch, I also included credentials to GitHub in the “stable” resource definition. My pipeline has two jobs: one that runs the JUnit tests, and another puts the master branch code into the stable branch if the unit tests pass.

    ---
    # declare resources
    resources:
    - name: source-master
      type: git
      icon: github-circle
      source:
        uri: https://github.com/rseroter/boot-kpack-demo
        branch: master
    - name: source-stable
      type: git
      icon: github-circle
      source:
        uri: git@github.com:rseroter/boot-kpack-demo.git
        branch: stable
        private_key: ((github-private-key))
    
    jobs:
    - name: run-tests
      plan:
      - get: source-master
        trigger: true
      - task: first-task
        config: 
          platform: linux
          image_resource:
            type: docker-image
            source: {repository: maven, tag: latest}
          inputs:
          - name: source-master
          run:
              path: sh
              args:
              - -exec
              - |
                cd source-master
                mvn package
    - name: promote-to-stable
      plan:
      - get: source-master
        trigger: true
        passed: [run-tests]
      - get: source-stable
      - put: source-stable
        params:
          repository: source-master
    

    Deploying this pipeline is easy. From the fly CLI tool, it’s one command. Note that my GitHub creds are stored in another file, which is the one I reference in the command.

    fly -t vmworld set-pipeline --pipeline vmworld-pipeline --config vmworld-pipeline.yaml --load-vars-from params.yaml
    

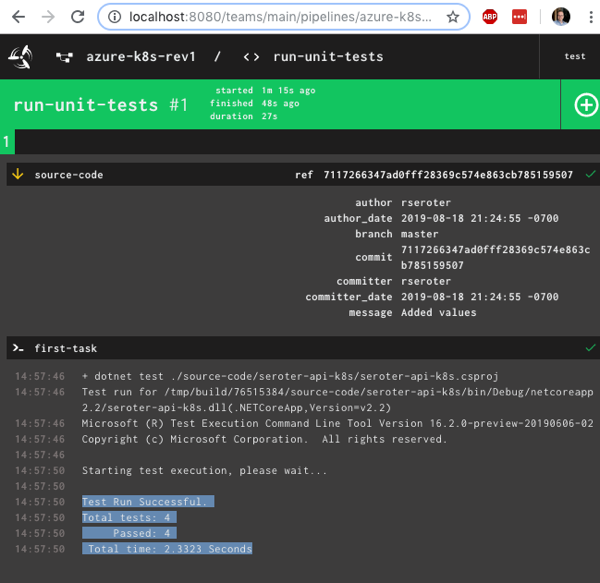
    After unpausing the pipeline, it ran. Once it executed the unit tests, and promoted the master code to the stable branch, the pipeline was green.

    Step #3 – Set up kpack for container builds

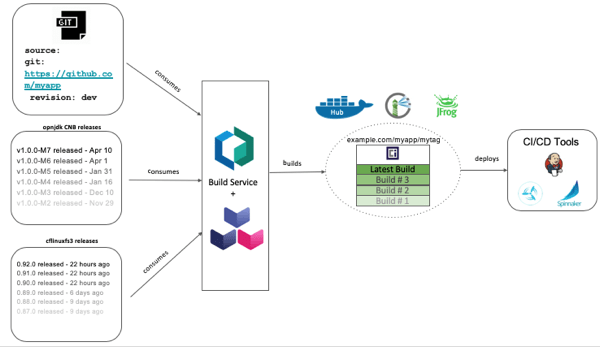
    Now to take that tested, high-quality code and containerize it. Cloud Native Buildpacks turn code into Docker images. Buildpacks are something initially created by Heroku, and then used by Cloud Foundry to algorithmically determine how to build a container image based on the language/framework of the code. Instead of developers figuring out how to layer up an image, buildpacks can compile and package up code in a repeatable way by bringing in all the necessary language runtimes and servers. What’s cool is that operators can also extend buildpacks to add org-specific certs, monitoring agents, or whatever else should be standard in your builds.

    kpack is an open-source project from Pivotal that uses Cloud Native Buildpacks, also adds the ability to watch for changes to anything impacting the image, and initiating an update. kpack, which is commercialized as the Pivotal Build Service, watches for changes in source code, buildpacks, or base image and then puts the new or patched image into the registry. Thanks to some smarts, it only updates the impacted layers, thus saving you on data transfer costs and build times.

    The installation instructions are fairly straightforward. You can put this into your Kubernetes cluster in a couple minutes. Once installed, I saw the single kpack controller pod running.

    The only thing left to do was define an image configuration. This declarative config tells kpack where to find the code, and what to do with it. I had already set up a secret to hold my Docker Hub creds, and that corresponding Kubernetes service account is referenced in the image configuration.

    apiVersion: build.pivotal.io/v1alpha1
    kind: Image
    metadata:
      name: vmworld-image
    spec:
      tag: rseroter/vmworld-demo
      serviceAccount: vmworld-service-account
      builder:
        name: default-builder
        kind: ClusterBuilder
      source:
        git:
          url: https://github.com/rseroter/boot-kpack-demo.git
          revision: stable
    

    That’s it. Within moments, kpack detected my code repo, compiled my app, built a container image, cached some layers for later, and updated the Docker Hub image.

    I made a bunch of code changes to generate lots of builds, and all the builds showed up my Kubernetes cluster as well.

    Now when I updated my code, my pipeline automatically kicks off and updates the stable branch. Thus, whenever my tested code changes, or the buildpack gets updated (every week or so) with framework updates and patches, my container automatically gets rebuilt. That’s crazy powerful stuff, especially as we create more and more containers, that deploy to more and more places.

    Step #4 – Deploy the container image

    And that’s the final step. I had to deploy this sucker and see it run.

    First, I pushed it to Pivotal Application Service (PAS) because I make good choices. I can push code or containers here. This single command takes that Docker image, deploys it, and gives me a routable endpoint in 20 seconds.

    cf push vmworld-demo --docker-image rseroter/vmworld-demo -i 2
    

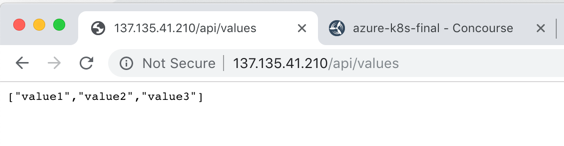
    That worked great, and my endpoint returned the expected values after I added an environment variable to the app.

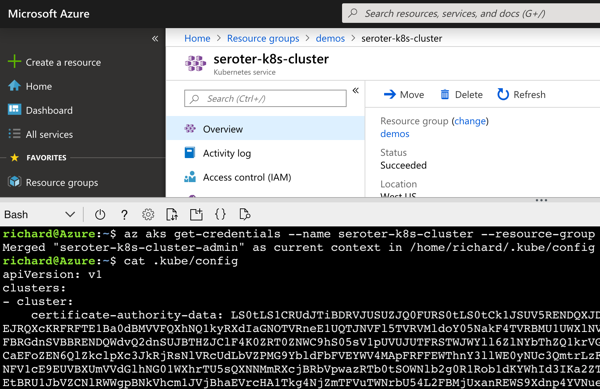
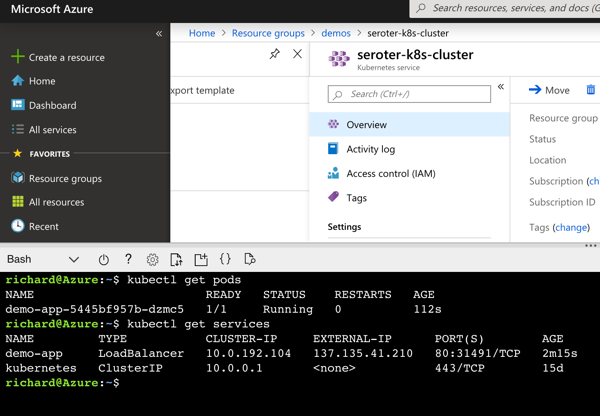
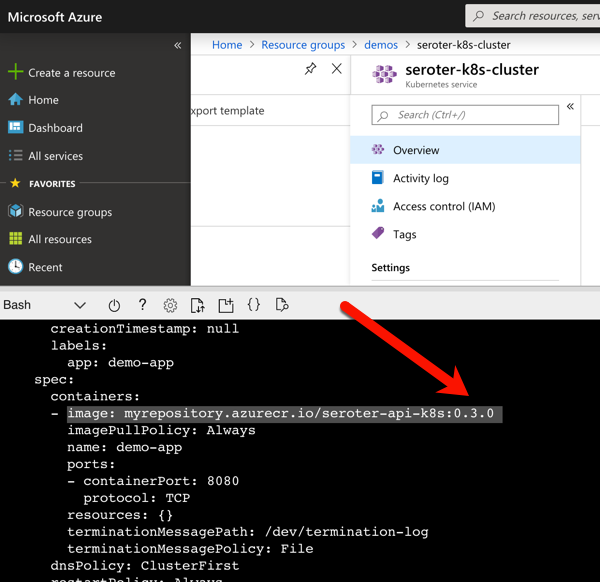
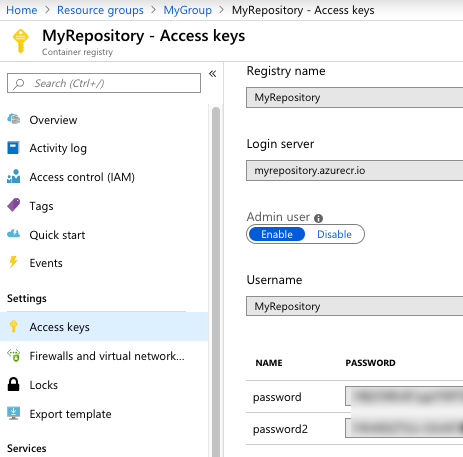
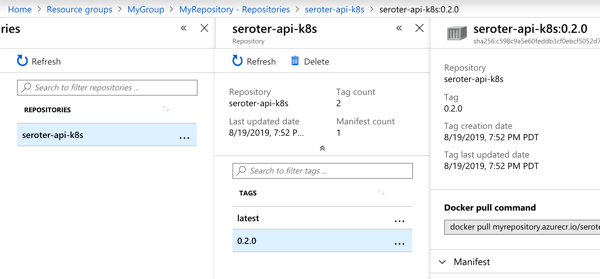
    Can I deploy the same container to Azure Web Apps? Sure. That takes code or containers too. I walked through the wizard experience in the Azure Portal and chose the Docker Hub image created by kpack.

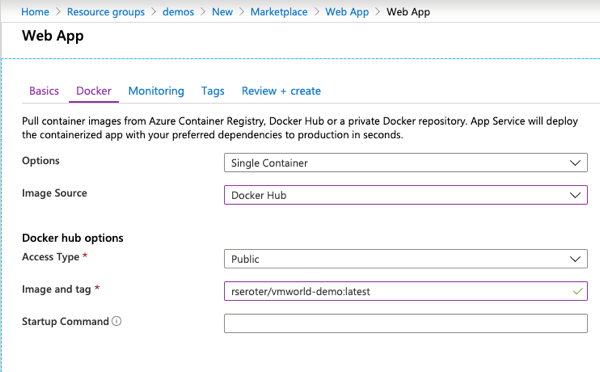
    After a few minutes, the service was up. Then I set the environment variable that the Spring Boot app was looking for (appruntime to “Azure App Service”) and another to expose the right port (WEBSITES_PORT to 8080), and pinged the RESTful endpoint.

    Whatever tech you land on, just promise me that you’ll invest in a container patching strategy. Automation is non-negotiable, and there are good solutions out there that can improve your security posture, while speeding up software delivery.

  • Fronting web sites, a classic .NET app, and a serverless function with Spring Cloud Gateway

    Fronting web sites, a classic .NET app, and a serverless function with Spring Cloud Gateway

    Automating deployment of custom code and infrastructure? Not always easy, but feels like a solved problem. It gets trickier when you want to use automation to instantiate and continuously update databases and middleware. Why? This type of software stores state which makes upgrades more sensitive. You also may be purchasing this type of software from vendors who haven’t provided a full set of automation-friendly APIs. Let’s zero in on one type of middleware: API gateways.

    API gateways do lots of things. They selectively expose private services to wider audiences. With routing rules, they make it possible to move clients between versions of a service without them noticing. They protect downstream services by offering capabilities like rate limiting and caching. And they offer a viable way for those with a microservices architecture to secure services without requiring each service to do their own authentication. Historically, your API gateway was a monolith of its own. But a new crop of automation-friendly OSS (and cloud-hosted) options are available, and this gives you new ways to deploy many API gateway instances that get continuously updated.

    I’ve been playing around with Spring Cloud Gateway, which despite its name, can proxy traffic to a lot more than just Spring Boot applications. In fact, I wanted to try and create a configuration-only-no-code API Gateway that could do three things:

    1. Weighted routing between “regular’ web pages on the internet.
    2. Add headers to a JavaScript function running in Microsoft Azure.
    3. Performing rate-limiting on a classic ASP.NET Web Service running on the Pivotal Platform.

    Before starting, let me back up and briefly explain what Spring Cloud Gateway is. Basically, it’s a project that turns a Spring Boot app into an API gateway that routes requests while applying cross-cutting functionality for things like security. Requests come in, and if the request matches a declared route, the request is passed through a series of filters, sent to the target endpoint, and “post” filters get applied on the way back to the client. Spring Cloud Gateway built on a Reactive base, which means it’s non-blocking and efficiently handles many simultaneous requests.

    The biggest takeaway? This is just an app. You can write tests and do continuous integration. You can put it on a pipeline and continuously deliver your API gateway. That’s awesome.

    Note that you can easily follow along with the steps below without ANY Java knowledge! Everything I’m doing using configuration you can also do with the Java DSL, but I wanted to prove how straightforward the configuration-only option is.

    Creating the Spring Cloud Gateway project

    This is the first, and easiest, part of this demonstration. I went to start.spring.io, and generated a new Spring Boot project. This project has dependencies on Gateway (to turn this into an API gateway), Spring Data Reactive Redis (for storing rate limiting info), and Spring Boot Actuator (so we get “free” metrics and insight into the gateway). Click this link to generate an identical project.

    Doing weighed routing between web pages

    For the first demonstration, I wanted to send traffic to either spring.io or pivotal.io/spring-app-framework. You might use weighted routing to do A/B testing with different versions of your site, or even to send a subset of traffic to a new API.

    I added an application.yml file (to replace the default application.properties file) to hold all my configuration settings. Here’s the configuration, and we’ll go through it bit by bit.

    spring:
      cloud:
        gateway:
          routes:
          # doing weighted routing between two sites
          - id: test1
            uri: https://www.pivotal.io
            predicates:
            - Path=/spring
            - Weight=group1, 3
            filters:
            - SetPath=/spring-app-framework
          - id: test2
            uri: https://www.spring.io
            predicates:
            - Path=/spring
            - Weight=group1, 7
            filters:
            - SetPath=/
    

    Each “route” is represented by a section in the YAML configuration. A route has a URI (which represents the downstream host), and a route predicate that indicates the path on the gateway you’re invoking. For example, in this case, my path is “/spring” which means that sending a request to “localhost:8080/spring” would map to this route configuration.

    Now, you’ll see I have two routes with the same path. These are part of the same weighted routing group, which means that traffic to /spring will go to one of the two downstream endpoints. The second endpoint is heavily weighted (7 vs 3), so most traffic goes there. Also see that I applied one filter to clear out the path. If I didn’t do this, then requests to localhost:8080/spring would result in a call to spring.io/spring, as the path (and querystring) is forwarded. Instead, I stripped that off for requests to spring.io, and added the secondary path into the pivotal.io endpoint.

    I’ve got Java and Maven installed locally, so a simple command (mvn spring-boot:run) starts up my Spring Cloud Gateway. Note that so far, I’ve written exactly zero code. Thanks to Spring Boot autoconfiguration and dependency management, all the right packages exist and runtime objects get inflated. Score!

    Once, the Spring Cloud Gateway was up and running, I pinged the Gateway’s endpoint in the browser. Note that some browser’s try to be helpful by caching things, which screws up a weighted routing demo! I opened the Chrome DevTools and disabled request caching before running a test.

    That worked great. Our gateway serves up a single endpoint, but through basic configuration, I can direct a subset of traffic somewhere else.

    Adding headers to serverless function calls

    Next, I wanted to stick my gateway in front of some serverless functions running in Azure Functions. You could imagine having a legacy system that you were slowly strangling and replacing with managed services, and leveraging Spring Cloud Gateway to intercept calls and redirect to the new destination.

    For this example, I built a dead-simple JavaScript function that’s triggered via HTTP call. I added a line of code that prints out all the request headers before sending a response to the caller.

    The Spring Cloud Gateway configuration is fairly simple. Let’s walk through it.

    spring:
      cloud:
        gateway:
          routes:
          # doing weighted routing between two sites
          - id: test1
            ...
          # adding a header to an Azure Function request
          - id: test3
            uri: https://seroter-function-app.azurewebsites.net
            predicates:
            - Path=/function
            filters:
            - SetPath=/api/HttpTrigger1
            - SetRequestHeader=X-Request-Seroter, Pivotal
    

    Like before, I set the URI to the target host, and set a gateway path. On the pre-filters, I reset the path (removing the /function and replacing with the “real” path to the Azure Function) and added a new request header.

    I started up the Spring Cloud Gateway project and sent in a request via Postman. My function expects a “name” value, which I provided as a query parameter.

    I jumped back to the Azure Portal and checked the logs associated with my Azure Function. Sure enough, I see all the HTTP request headers, including the random one that I added via the gateway. You could imagine this type of functionality helping if you have modern endpoints and legacy clients and need to translate between them!

    Applying rate limiting to an ASP.NET Web Service

    You know what types of apps can benefit from an API Gateway? Legacy apps that weren’t designed for high load or modern clients. One example is rate limiting. Your legacy service may not be able to handle internet-scale requests, or have a dependency on a downstream system that isn’t mean to get pummeled with traffic. You can apply request caching and rate limiting to prevent clients from burying the legacy app.

    First off, I built a classic ASP.NET Web Service. I hoped to never use SOAP again, but I’m dedicated to my craft.

    I did a “cf push” to my Pivotal Application Service environment and deployed two instances of the app to a Windows environment. In a few seconds, I had a publicly-accessible endpoint.

    Then it was back to my Gateway configuration. To do rate limiting, you need a way to identify callers. You know, some way to say that client X has exceeded their limit. Out of the box, there’s a rate limiter that uses Redis to store information about clients. That means I need a Redis instance. The simplest answer is “Docker”, so I ran a simple command to get Redis running locally (docker run --name my-redis -d -p 6379:6379 redis).

    I also needed a way to identify the caller. Here, I finally had to write some code. Specifically, this rate limiter filter expects a “key resolver.” I don’t see a way to declare one via configuration, so I opened the .java file in my project and added a Bean declaration that pulls a query parameter named “user.” That’s not enterprise ready (as you’d probably pull source IP, or something from a header), but this’ll do.

    @SpringBootApplication
    public class CloudGatewayDemo1Application {
    
      public static void main(String[] args) {	 
       SpringApplication.run(CloudGatewayDemo1Application.class, args);
      }
    	
      @Bean
      KeyResolver userKeyResolver() {
        return exchange -> 
       Mono.just(exchange.getRequest().getQueryParams().getFirst("user"));
      }
    }
    

    All that was left was my configuration. Besides adding rate limiting, I also wanted to to shield the caller from setting all those gnarly SOAP-related headings, so I added filters for that too.

    spring:
      cloud:
        gateway:
          routes:
          # doing weighted routing between two sites
          - id: test1
            ...
            
          # adding a header to an Azure Function request
          - id: test3
            ...
            
          # introducing rate limiting for ASP.NET Web Service
          - id: test4
            uri: https://aspnet-web-service.apps.pcfone.io
            predicates:
            - Path=/dotnet
            filters:
            - name: RequestRateLimiter
              args:
                key-resolver: "#{@userKeyResolver}"
                redis-rate-limiter.replenishRate: 1
                redis-rate-limiter.burstCapacity: 1
            - SetPath=/MyService.asmx
            - SetRequestHeader=SOAPAction, http://pivotal.io/SayHi
            - SetRequestHeader=Content-Type, text/xml
            - SetRequestHeader=Accept, text/xml
    

    Here, I set the replenish rate, which is how many request per second per user, and burst capacity, which is the max number of requests in a single second. And I set the key resolver to that custom bean that reads the “user” querystring parameter. Finally, notice the three request headers.

    I once again started up the Spring Cloud Gateway, and send a SOAP payload (no extra headers) to the localhost:8080/dotnet endpoint.

    A single call returned the expected response. If I rapidly submitted requests in, I saw an HTTP 429 response.

    So almost zero code to do some fairly sophisticated things with my gateway. None of those things involved a Java microservice, although obviously, Spring Cloud Gateway does some very nice things for Spring Boot apps.

    I like this trend of microservices-machinery-as-code where I can test and deploy middleware the same way I do custom apps. The more things we can reliably deliver via automation, the more bottlenecks we can remove.

  • First Look: Building Java microservices with the new Azure Spring Cloud

    First Look: Building Java microservices with the new Azure Spring Cloud

    One of the defining characteristics of the public cloud is choice. Need to host an app? On-premises, your choices were a virtual machine or a virtual machine. Now? A public cloud like Microsoft Azure offers nearly a dozen options. You’ve got spectrum of choices ranging from complete control over the stack (e.g. Azure Virtual Machines) to opinionated runtimes (e.g. Azure Functions). While some of these options, like Azure App Service, cater to custom software, no platforms cater to a specific language or framework. Until today.

    At Pivotal’s SpringOne Platform conference, Microsoft took the wraps off Azure Spring Cloud. This first-party managed service sits atop Azure Kubernetes Service and helps Java developers run cloud-native apps. How? It runs managed instances of Spring Cloud components like a Config Server and Service Registry. It builds secure container images using Cloud Native Buildpacks and kpack (both, Pivotal-sponsored OSS). It offers secure binding to other Azure services like Cosmos DB. It has integrated load balancing, log streaming, monitoring, and distributed tracing. And it delivers rolling upgrades and blue-green deployments so that it’s easy to continuously deliver changes. At the moment, Azure Spring Cloud is available as a private preview, so I thought I’d give you a quick tour.

    First off, since it’s a first-party service, I can provision instances via the az command line tool, or the Azure Portal. From the Azure Portal, it’s quite simple. You just provide an Azure subscription, target region, and resource name.

    Once my instance was created, I accessed the unique dashboard for Azure Spring Cloud. I saw some of the standard things that are part of every service (e.g. activity log, access control), as well as the service-specific things like Apps, Config Server, Deployments, and more.

    A Spring Cloud Config Server pulls and aggregates name-value pairs from various sources and serves them up to your application via a single interface. In a typical architecture, you have to host that somewhere. For Azure Spring Cloud, it’s a managed service. So, all I need to do is point this instance to a repository holding my configuration files, and I’m set.

    There’s no “special” way to build Spring Boot apps that run here. They’re just … apps. So I went to start.spring.io to generate my project scaffolding. Here, I chose dependencies for web, eureka (service registry), config client, actuator (health monitoring), and zipkin + sleuth (distributed tracing). Click here to generate an identical project.

    My sample code is basic here. I just expose a REST endpoint, and pull a property value from the attached configuration store.

    @RestController
    @SpringBootApplication
    public class AzureBasicAppApplication {
    
    	public static void main(String[] args) {
    	  SpringApplication.run(AzureBasicAppApplication.class, args);
    	}
    	
    	@Value("${company:Not configured by a Spring Cloud Server}")
            private String company;
    	
    	@GetMapping("/hello")
    	public String Hello() {
    	  return "hello, from " + company;
    	}
    }
    

    To deploy, first I create an application from the CLI or Portal. “Creating” the application doesn’t deploy it, as that’s a separate step.

    With that created, I packaged my Spring Boot app into a JAR file, and deployed it via the az CLI.

    az spring-cloud app deploy -n azure-app --jar-path azure-basic-app-0.0.1-SNAPSHOT.jar

    What happened next? Azure Spring Cloud created a container image, stored it in an Azure Container Registry, and deployed it to AKS. And you don’t need to care about any of that, as you can’t access the registry or AKS! It’s plumbing, that forms a platform. After a few moments, I saw my running instance, and the service registry shows that my instance is UP.

    We’re dealing with containers here, so scaling is fast and easy. The “scale” section lets me scale up with more RAM and CPU, or out with more instances.

    Cloud native, 12-factor apps should treat backing services like attached resources. Azure Spring Cloud embodies this by letting me set up service bindings. Here, I set up a linkage to another Azure service, and at runtime, its credentials and connection string are injected into the app’s configuration. All of this is handled auto-magically by the Spring Boot starters from Azure.

    Logging data goes into Azure Monitor. You can set up Log Analytics for analysis, or pump out to a third party Application Performance Monitoring tool.

    So you have logging, you have built-in monitoring, and you ALSO get distributed tracing. For microservices, this helps you inspect the call graph and see where your performance bottlenecks are. The pic below is from an example app built by Julien at Microsoft.

    Finally, I can do blue/green deploy. This means that I deploy a second instance of the app (via the az CLI, it’s another “deployment”), can independently test it, and then choose to swap traffic over to that instance when I’m ready. If something goes wrong, I can switch back.

    So far, it’s pretty impressive. This is one of the first industry examples of turning Kubernetes into an actual application platform. There’s more functionality planned as the service moves to public preview, beta, and general availability. I’m happy to see Microsoft make such a big bet on Spring, and even happier that developers have a premium option for running Java apps in the public cloud.

  • Messing around with Apache Kafka using the Confluent Cloud free trial

    Messing around with Apache Kafka using the Confluent Cloud free trial

    This week, Confluent announced that there’s now a free trial for their Confluent Cloud. If you’re unfamiliar with either, Confluent is the company founded by the creators of Apache Kafka, and Confluent Cloud is their managed Kafka offering that runs on every major public cloud. There are various ways to kind-of use Kafka in the public cloud (e.g. Amazon Managed Streaming for Apache Kafka, Azure Event Hubs with Kafka interface), but what Confluent offers is the single, best way to use the full suite of Apache Kafka capabilities as a managed service. It’s now free to try out, so I figured I’d take it for a spin.

    First, I went to the Confluent Cloud site and clicked the “try free” button. I was prompted to create an account.

    I was asked for credit card info to account for overages above the free tier (and after the free credits expire in 3 months), which I provided. With that, I was in.

    First, I was prompted to create a cluster. I do what I’m told.

    Here, I was asked to provide a cluster name, and choose a public cloud provider. For each cloud, I was shown a set of available regions. Helpfully, the right side also showed me the prices, limits, billing cycle, and SLA. Transparency, FTW!

    While that was spinning up, I followed the instructions to install the Confluent Cloud CLI so that I could also geek-out at the command line. I like the the example CLI commands in the docs actually reflect the values of my environment (e.g. cluster name). Nice touch.

    Within maybe a minute, my Kafka cluster was running. That’s pretty awesome. I chose to create a new topic with 6 partitions. I’m able to choose up to 60 partitions for a topic, and define other settings like data retention period, max size on disk, and cleanup policy.

    Before building an app to publish data to Confluent Cloud, I needed an API key and secret. I could create this via the CLI, or the dashboard. I generated the key via the dashboard, saved it (since I can’t see it again after generating), and saw the example Java client configuration updated with those values. Handy, especially because I’m going to talk to Kafka via Spring Cloud Stream!

    Now I needed an app that would send messages to Apache Kafka in the Confluent Cloud. I chose Spring Boot because I make good decisions. Thanks to the Spring Cloud Stream project, it’s super-easy to interact with Apache Kafka without having to be an expert in the tech itself. I went to start.spring.io to generate a project. If you click this link, you can download an identical project configuration.

    I opened up this project and added the minimum code and configuration necessary to gab with Apache Kafka in Confluent Cloud. I wanted to be able to submit an HTTP request and see that message published out. That required one annotation to create a REST controller, and one annotation to indicate that this app is a source to the stream. I then have a “Source” variable is autowired, which means it’s inflated by Spring Boot at runtime. Finally, I have a single operation that responds to an HTTP post command and writes the payload to the message stream. That’s it!

    package com.seroter.confluentboot;
    
    import org.springframework.beans.factory.annotation.Autowired;
    import org.springframework.boot.SpringApplication;
    import org.springframework.boot.autoconfigure.SpringBootApplication;
    import org.springframework.cloud.stream.annotation.EnableBinding;
    import org.springframework.cloud.stream.messaging.Source;
    import org.springframework.messaging.support.GenericMessage;
    import org.springframework.web.bind.annotation.PostMapping;
    import org.springframework.web.bind.annotation.RequestBody;
    import org.springframework.web.bind.annotation.RestController;
    
    @EnableBinding(Source.class)
    @RestController
    @SpringBootApplication
    public class ConfluentBootApplication {
    
        public static void main(String[] args) {
          SpringApplication.run(ConfluentBootApplication.class, args);
        }
    	
        @Autowired
        private Source source;
     
        @PostMapping("/messages")
        public String postMsg(@RequestBody String msg) {
         this.source.output().send(new GenericMessage<>(msg));
         return "success";
        }
    }
    

    The final piece? The application configuration. In the application.properties file, I set the handful of parameters, mostly around the target cluster, topic name, and credentials.

    spring.cloud.stream.kafka.binder.brokers=pkc-41973.westus2.azure.confluent.cloud:9092
    spring.cloud.stream.bindings.output.destination=seroter-topic
     
    spring.cloud.stream.kafka.binder.configuration.sasl.jaas.config=org.apache.kafka.common.security.plain.PlainLoginModule required username="[KEY]" password="[SECRET]";
    spring.cloud.stream.kafka.binder.configuration.sasl.mechanism=PLAIN
    spring.cloud.stream.kafka.binder.configuration.security.protocol=SASL_SSL
    

    I started up the app, confirmed that it connected (via application logs), and opened Postman to issue an HTTP POST command.

    After switching back to the Confluent Cloud dashboard, I saw my messages pop up.

    You can probably repeat this whole demo in about 10 minutes. As you can imagine, there’s a LOT more you can do with Apache Kafka than what I showed you. If you want an environment to learn Apache Kafka in depth, it’s now a no-brainer to spin up a free account in Confluent Cloud. And if you want to use a legit managed Apache Kafka for production in any cloud, this seems like a good bet as well.

  • Building an Azure-powered Concourse pipeline for Kubernetes  – Part 3: Deploying containers to Kubernetes

    Building an Azure-powered Concourse pipeline for Kubernetes – Part 3: Deploying containers to Kubernetes

    So far in this blog series, we’ve set up our local machine and cloud environment, and built the initial portion of a continuous delivery pipeline. That pipeline, built using the popular OSS tool Concourse, pulls source code from GitHub, generates a Docker image that’s stored in Azure Container Registry, and produces a tarball that’s stashed in Azure Blob Storage. What’s left? Deploying our container image to Azure Kubernetes Service (AKS). Let’s go.

    Generating AKS credentials

    Back in blog post one, we set up a basic AKS cluster. For Concourse to talk to AKS, we need credentials!

    From within the Azure Portal, I started up an instance of the Cloud Shell. This is a hosted Bash environment with lots of pre-loaded tools. From here, I used the AKS CLI to get the administrator credentials for my cluster.

    az aks get-credentials --name seroter-k8s-cluster --resource-group demos --admin

    This command generated a configuration file with URLs, users, certificates, and tokens.

    I copied this file locally for use later in my pipeline.

    Creating a role-binding for permission to deploy

    The administrative user doesn’t automatically have rights to do much in the default cluster namespace. Without explicitly allowing permissions, you’ll get some gnarly “does not have access” errors when doing most anything. Enter role-based access controls. I created a new rolebinding named “admin” with admin rights in the cluster, and mapped to the existing clusterAdmin user.

    kubectl create rolebinding admin --clusterrole=admin --user=clusterAdmin --namespace=default

    Now I knew that Concourse could effectively interact with my Kubernetes cluster.

    Giving AKS access to Azure Container Registry

    Right now, Azure Container Registry (ACR) doesn’t support an anonymous access strategy. Everything happens via authenticated users. The Kubernetes cluster needs access to its container registry, so I followed these instructions to connect ACR to AKS. Pretty easy!

    Creating Kubernetes deployment and service definitions

    Concourse is going to apply a Kubernetes deployment to create pods of containers in the cluster. Then, Concourse will apply a Kubernetes service to expose my pod with a routable endpoint.

    I created a pair of configurations and added them to the ci folder of my source code.

    The deployment looks like:

    apiVersion: extensions/v1beta1
     kind: Deployment
     metadata:
       name: demo-app
       namespace: default
       labels:
         app: demo-app
     spec:
       replicas: 1
       template:
         metadata:
           labels:
             app: demo-app
         spec:
           containers:
           - name: demo-app
             image: myrepository.azurecr.io/seroter-api-k8s:latest
             imagePullPolicy: Always
             ports:
             - containerPort: 8080
           restartPolicy: Always 
    

    This is a pretty basic deployment definition. It points to the latest image in the ACR and deploys a single instance (replicas: 1).

    My service is also fairly simple, and AKS will provision the necessary Azure Load Balancer and public IP addresses.

     apiVersion: v1
     kind: Service
     metadata:
       name: demo-app
       namespace: default
       labels:
         app: demo-app
     spec:
       selector:
         app: demo-app
       type: LoadBalancer
       ports:
         - name: web
           protocol: TCP
           port: 80
           targetPort: 80 
    

    I now had all the artifacts necessary to finish up the Concourse pipeline.

    Adding Kubernetes resource definitions to the Concourse pipeline

    First, I added a new resource type to the Concourse pipeline. Because Kubernetes isn’t a baked-in resource type, we need to pull in a community definition. No problem. This one’s pretty popular. It’s important than the Kubernetes client and server are expecting the same Kubernetes version, so I set the tag to match my AKS version.

    resource_types:
    - name: kubernetes
      type: docker-image
      source:
        repository: zlabjp/kubernetes-resource
        tag: "1.13"
    

    Next, I had to declare my resource itself. It has references to the credentials we generated earlier.

    resources:
    - name: azure-kubernetes-service
      type: kubernetes
      icon: azure
      source:
        server: ((k8s-server))
        namespace: default
        token: ((k8s-token))
        certificate_authority: |
          -----BEGIN CERTIFICATE-----
          [...]
          -----END CERTIFICATE-----
    

    There are a few key things to note here. First, the “server” refers to the cluster DNS server name in the credentials file. The “token” refers to the token associated with the clusterAdmin user. For me, it’s the last “user” called out in the credentials file. Finally, let’s talk about the certificate authority. This value comes from the “certificate-authority-data” entry associated with the cluster DNS server. HOWEVER, this value is base64 encoded, and I needed a decoded value. So, I decoded it, and embedded it as you see above.

    The last part of the pipeline? The job!

    jobs:
    - name: run-unit-tests
      [...]
    - name: containerize-app
      [...]
    - name: package-app
      [...]
    - name: deploy-app
      plan:
      - get: azure-container-registry
        trigger: true
        passed:
        - containerize-app
      - get: source-code
      - get: version
      - put: azure-kubernetes-service
        params:
          kubectl: apply -f ./source-code/seroter-api-k8s/ci/deployment.yaml -f ./source-code/seroter-api-k8s/ci/service.yaml
      - put: azure-kubernetes-service
        params:
          kubectl: |
            patch deployment demo-app -p '{"spec":{"template":{"spec":{"containers":[{"name":"demo-app","image":"myrepository.azurecr.io/seroter-api-k8s:'$(cat version/version)'"}]}}}}' 
    

    Let’s unpack this. First, I “get” the Azure Container Registry resource. When it changes (because it gets a new version of the container), it triggers this job. It only fires if the “containerize app” job passes first. Then I get the source code (so that I can grab the deployment.yaml and service.yaml files I put in the ci folder), and I get the semantic version.

    Next I “put” to the AKS resource, twice. In essence, this resource executes kubectl commands. The first command does a kubectl apply for both the deployment and service. On the first run, it provisions the pod and exposes it via a service. However, because the container image tag in the deployment file is to “latest”, Kubernetes actually won’t retrieve new images with that tag after I apply a deployment. So, I “patched” the deployment in a second “put” step and set the deployment’s image tag to the semantic version. This triggers a pod refresh!

    Deploy and run the Concourse pipeline

    I deployed the pipeline as a new revision with this command:

    fly -t rs set-pipeline -c azure-k8s-final.yml -p azure-k8s-final

    I unpaused the pipeline and watched it start up. It quickly reached and completed the “deploy to AKS” stage.

    But did it actually work? I jumped back into the Azure Cloud Shell to check it out. First, I ran a kubectl get pods command. Then, a kubectl get services command. The first showed our running pod, and the second showed the external IP assigned to my pod.

    I also issued a request to that URL in the browser, and got back my ASP.NET Core API results.

    Also to prove that my “patch” command worked, I ran the kubectl get deployment demo-app –output=yaml command to see which container image my deployment referenced. As you can see below, it no longer references “latest” but rather, a semantic version number.

    With all of these settings, I now have a pipeline that “just works” whenever I updated my ASP.NET Core source code. It tests the code, packages it up, and deploys it to AKS in seconds. I’ve added all the pipelines we created here to GitHub so that you can easily try this all out.

    Whatever CI/CD tool you use, invest in automating your path to production.

  • Building an Azure-powered Concourse pipeline for Kubernetes  – Part 2: Packaging and containerizing code

    Building an Azure-powered Concourse pipeline for Kubernetes – Part 2: Packaging and containerizing code

    Let’s continuously deliver an ASP.NET Core app to Kubernetes using Concourse. In part one of this blog series, I showed you how to set up your environment to follow along with me. It’s easy; just set up Azure Container Registry, Azure Storage, Azure Kubernetes Service, and Concourse. In this post, we’ll start our pipeline by pulling source code, running unit tests, generating a container image that’s stored in Azure Container Registry, and generating a tarball for Azure Blob Storage.

    We’re building this pipeline with Concourse. Concourse has three core primitives: tasks, jobs, and resources. Tasks form jobs, jobs form pipelines, and state is stored in resources. Concourse is essentially stateless, meaning there are no artifacts on the server after a build. You also don’t register any plugins or extensions. Rather, the pipeline is executed in containers that go away after the pipeline finishes. Any state — be it source code or Docker images — resides in durable resources, not Concourse itself.

    Let’s start building a pipeline.

    Pulling source code

    A Concourse pipeline is defined in YAML. Concourse ships with a handful of “known” resource types including Amazon S3, git, and Cloud Foundry. There are dozens and dozens of community ones, and it’s not hard to build your own. Because my source code is stored in GitHub, I can use the out-of-the-box resource type for git.

    At the top of my pipeline, I declared that resource.

    ---
    resources:
    - name: source-code
      type: git
      icon: github-circle
      source:
        uri: https://github.com/rseroter/seroter-api-k8s
        branch: master
    

    I’ve gave the resource a name (“source-code”) and identified where the code lives. That’s it! Note that when you deploy a pipeline, Concourse produces containers that “check” resources on a schedule for any changes that should trigger a pipeline.

    Running unit tests

    Next up? Build a working version of a pipeline that does something. Specifically, it should execute unit tests. That means we need to define a job.

    A job has a build plan. That build plan contains any of three things: get steps (to retrieve a resource), put steps (to push something to a resource), and task steps (to run a script). Our job below has one get step (to retrieve source code), and one task (to execute the xUnit tests).

    jobs:
    - name: run-unit-tests
      plan:
      - get: source-code
        trigger: true
      - task: first-task
        config: 
          platform: linux
          image_resource:
            type: docker-image
            source: {repository: mcr.microsoft.com/dotnet/core/sdk}
          inputs:
          - name: source-code
          run:
              path: sh
              args:
              - -exec
              - |
                dotnet test ./source-code/seroter-api-k8s/seroter-api-k8s.csproj 
    

    Let’s break it down. First, my “plan” gets the source-code resource. And because I set “trigger: true” Concourse will kick off this job whenever it detects a change in the source code.

    Next, my build plan has a “task” step. Tasks run in containers, so you need to choose a base image that runs the user-defined script. I chose the Microsoft-provided .NET Core image so that I’d be confident it had all the necessary .NET tooling installed. Note that my task has an “input.” Since tasks are like functions, they have inputs and outputs. Anything I input into the task is mounted into the container and is available to any scripts. So, by making the source-code an input, my shell script can party on the source code retrieved by Concourse.

    Finally, I embedded a short script that invokes the “dotnet test” command. If I were being responsible, I’d refactor this embedded script into an external file and reference that file. But hey, this is easier to read.

    This is now a valid pipeline. In the previous post, I had you install the fly CLI to interact with Concourse. From the fly CLI, I deploy pipelines with the following command:

    fly -t rs set-pipeline -c azure-k8s-rev1.yml -p azure-k8s-rev1

    That command says to use the “rs” target (which points to a given Concourse instance), use the YAML file holding the pipeline, and name this pipeline azure-k8s-rev1. It deployed instantly, and looked like this in the Concourse web dashboard.

    After unpausing the pipeline so that it came alive, I saw the “run unit tests” job start running. It’s easy to view what a job is doing, and I saw that it loaded the container image from Microsoft, mounted the source code, ran my script and turned “green” because all my tests passed.

    Nice! I had a working pipeline. Now to generate a container image.

    Producing and publishing a container image

    A pipeline that just run tests is kinda weird. I need to do something when tests pass. In my case, I wanted to generate a Docker image. Another of the built-in Concourse resource types is “docker-image” which generates a container image and puts it into a registry. Here’s the resource definition that worked with Azure Container Registry:

    resources:
    - name: source-code
      [...]
    - name: azure-container-registry
      type: docker-image
      icon: docker
      source:
        repository: myrepository.azurecr.io/seroter-api-k8s
        tag: latest
        username: ((azure-registry-username))
        password: ((azure-registry-password))
    

    Where do you get those Azure Container Registry values? From the Azure Portal, they’re visible under “Access keys.” I grabbed the Username and one of the passwords.

    Next, I added a new job to the pipeline.

    jobs:
    - name: run-unit-tests
      [...]
    - name: containerize-app
      plan:
      - get: source-code
        trigger: true
        passed:
        - run-unit-tests
      - put: azure-container-registry
        params:
          build: ./source-code
          tag_as_latest: true
    

    What’s this job doing? Notice that I “get” the source code again. I also set a “passed” attribute meaning this will only run if the unit test step completes successfully. This is how you start chaining jobs together into a pipeline! Then I “put” into the registry. Recall from the first blog post that I generated a Dockerfile from within Visual Studio for Mac, and here, I point to it. The resource does a “docker build” with that Dockerfile, tags the resulting image as the “latest” one, and pushes to the registry.

    I pushed this as a new pipeline to Concourse:

    fly -t rs set-pipeline -c azure-k8s-rev2.yml -p azure-k8s-rev2

    I now had something that looked like a pipeline.

    I manually triggered the “run unit tests” job, and after it completed, the “containerize app” job ran. When that was finished, I checked Azure Container Registry and saw a new repository one with image in it.

    Generating and storing a tarball

    Not every platform wants to run containers. BLASPHEMY! BURN THE HERETIC! Calm down. Some platforms happily take your source code and run it. So our pipeline should also generate a single artifact with all the published ASP.NET Core files.

    I wanted to store this blob in Azure Storage. Since Azure Storage isn’t a built-in Concourse resource type, I needed to reference a community one. No problem finding one. For non-core resources, you have to declare the resource type in the pipeline YAML.

    resource_types:
    - name: azure-blobstore
      type: docker-image
      source:
        repository: pcfabr/azure-blobstore-resource
    

    A resource type declaration is fairly simple; it’s just a type (often docker-image) and then the repo to get it from.

    Next, I needed the standard resource definition. Here’s the one I created for Azure Storage:

    name: azure-blobstore
      type: azure-blobstore
      icon: azure
      source:
        storage_account_name: ((azure-storage-account-name))
        storage_account_key: ((azure-storage-account-key))
        container: coreapp
        versioned_file: app.tar.gz
    

    Here the “type” matches the resource type name I set earlier. Then I set the credentials (retrieved from the “Access keys” section in the Azure Portal), container name (pre-created in the first blog post), and the name of the file to upload. Regex is supported here too.

    Finally, I added a new job that takes source code, runs a “publish” command, and creates a tarball from the result.

    jobs:
    - name: run-unit-tests
      [...]
    - name: containerize-app
      [...]
    - name: package-app
      plan:
      - get: source-code
        trigger: true
        passed:
        - run-unit-tests
      - task: first-task
        config:
          platform: linux
          image_resource:
            type: docker-image
            source: {repository: mcr.microsoft.com/dotnet/core/sdk}
          inputs:
          - name: source-code
          outputs:
          - name: compiled-app
          - name: artifact-repo
          run:
              path: sh
              args:
              - -exec
              - |
                dotnet publish ./source-code/seroter-api-k8s/seroter-api-k8s.csproj -o .././compiled-app
                tar -czvf ./artifact-repo/app.tar.gz ./compiled-app
                ls
      - put: azure-blobstore
        params:
          file: artifact-repo/app.tar.gz
    

    Note that this job is also triggered when unit tests succeed. But it’s not connected to the containerization job, so it runs in parallel. Also note that in addition to an input, I also have outputs defined on the task. This generates folders that are visible to subsequent steps in the job. I dropped the tarball into the “artifact-repo” folder, and then “put” that file into Azure Blob Storage.

    I deployed this pipeline as yet another revision:

    fly -t rs set-pipeline -c azure-k8s-rev3.yml -p azure-k8s-rev3

    Now this pipeline’s looking pretty hot. Notice that I have parallel jobs that fire after I run unit tests.

    I once again triggered the unit test job, and watched the subsequent jobs fire. After the pipeline finished, I had another updated container image in Azure Container Registry and a file sitting in Azure Storage.

    Adding semantic version to the container image

    I could stop there and push to Kubernetes (next post!), but I wanted to do one more thing. I don’t like publishing Docker images with the “latest” tag. I want a real version number. It makes sense for many reasons, not the least of which is that Kubernetes won’t pick up changes to a container if the tag doesn’t change! Fortunately, Concourse has a default resource type for semantic versioning.

    There are a few backing stores for the version number. Since Concourse is stateless, we need to keep the version value outside of Concourse itself. I chose a git backend. Specifically, I added a branch named “version” to my GitHub repo, and added a single file (no extension) named “version”. I started the version at 0.1.0.

    Then, I ensured that my GitHub account had an SSH key associated with it. I needed this so that Concourse could write changes to this version file sitting in GitHub.

    I added a new resource to my pipeline definition, referencing the built-in semver resource type.

    - name: version  
      type: semver
      source:
        driver: git
        uri: git@github.com:rseroter/seroter-api-k8s.git
        branch: version
        file: version
        private_key: |
            -----BEGIN OPENSSH PRIVATE KEY-----
            [...]
            -----END OPENSSH PRIVATE KEY-----
    

    In that resource definition, I pointed at the repo URI, branch, file name, and embedded the private key for my account.

    Next, I updated the existing “containerization” job to get the version resource, use it, and then update it.

    jobs:
    - name: run-unit-tests
      [...] 
    - name: containerize-app
      plan:
      - get: source-code
        trigger: true
        passed:
        - run-unit-tests
      - get: version
        params: {bump: minor}
      - put: azure-container-registry
        params:
          build: ./source-code
          tag_file: version/version
          tag_as_latest: true
      - put: version
        params: {file: version/version}
    - name: package-app
      [...]
    

    First, I added another ‘get” for version. Notice that its parameter increments the number by one minor version. Then, see that the “put” for the container registry uses “version/version” as the tag file. This ensures our Docker image is tagged with the semantic version number. Finally, notice I “put” the incremented version file back into GitHub after using it successfully.

    I deployed a fourth revision of this pipeline using this command:

    fly -t rs set-pipeline -c azure-k8s-rev4.yml -p azure-k8s-rev4

    You see the pipeline, post-execution, below. The “version” resource comes into and out of the “containerize app” job.

    With the pipeline done, I saw that the “version” value in GitHub was incremented by the pipeline, and most importantly, our Docker image has a version tag.

    In this blog post, we saw how to gradually build up a pipeline that retrieves source and prepares it for downstream deployment. Concourse is fun and easy to use, and its extensibility made it straightforward to deal with managed Azure services. In the final blog post of this series, we’ll take pipeline-generated Docker image and deploy it to Azure Kubernetes Service.

  • Building an Azure-powered Concourse pipeline for Kubernetes  – Part 1: Setup

    Building an Azure-powered Concourse pipeline for Kubernetes – Part 1: Setup

    Isn’t it frustrating to build great software and helplessly watch as it waits to get deployed? We don’t just want to build software in small batches, we want to ship it in small batches. This helps us learn faster, and gives our users a non-stop stream of new value.

    I’m a big fan of Concourse. It’s a continuous integration platform that reflects modern cloud-native values: it’s open source, container-native, stateless, and developer-friendly. And all pipeline definitions are declarative (via YAML) and easily source controlled. I wanted to learn how build a Concourse pipeline that unit tests an ASP.NET Core app, packages it up and stashes a tarball in Azure Storage, creates a Docker container and stores it in Azure Container Registry, and then deploy the app to Azure Kubernetes Service. In this three part blog series, we’ll do just that! Here’s the final pipeline:

    This first posts looks at everything I did to set up the scenario.

    My ASP.NET Core web app

    I used Visual Studio for Mac to build a new ASP.NET Core Web API. I added NuGet package dependencies to xunit and xunit.runner.visualstudio. The API controller is super basic, with three operations.

    [Route("api/[controller]")]
    [ApiController]
    public class ValuesController : ControllerBase
    {
        [HttpGet]
        public ActionResult<IEnumerable<string>> Get()
        {
            return new string[] { "value1", "value2" };
        }
    
        [HttpGet("{id}")]
        public string Get(int id)
        {
            return "value1";
        }
    
        [HttpGet("{id}/status")]
        public string GetOrderStatus(int id)
        {
            if (id > 0 && id <= 20)
            {
                return "shipped";
            }
            else
            {
                return "processing";
            }
        }
    }
    

    I also added a Testing class for unit tests.

        public class TestClass
        {
            private ValuesController _vc;
    
            public TestClass()
            {
                _vc = new ValuesController();
            }
    
            [Fact]
            public void Test1()
            {
                Assert.Equal("value1", _vc.Get(1));
            }
    
            [Theory]
            [InlineData(1)]
            [InlineData(3)]
            [InlineData(9)]
            public void Test2(int value)
            {
                Assert.Equal("shipped", _vc.GetOrderStatus(value));
            }
        }
    

    Next, I right-clicked my project and added “Docker Support.”

    What this does is add a Docker Compose project to the solution, and Dockerfile to the project. Due to relative paths and such, if you try and “docker build” from directly within the project directory containing the Docker file, Docker gets angry. It’s meant to be invoked from the parent directory with a path to the project’s directory, like:

    docker build -f seroter-api-k8s/Dockerfile .

    I wasn’t sure if my pipeline could handle that nuance when containerizing my app, so just went ahead and moved the generated Dockerfile to the parent directory like in the screenshot below. From here, I could just execute the docker build command.

    You can find the complete project up on my GitHub.

    Instantiating an Azure Container Registry

    Where should we store our pipeline-created container images? You’ve got lots of options. You could use the Docker Hub, self-managed OSS projects like VMware’s Harbor, or cloud-specific services like Azure Container Registry. Since I’m trying to use all-things Azure, I chose the latter.

    It’s easy to set up an ACR. Once I provided the couple parameters via the Azure Dashboard, I had a running, managed container registry.

    Provisioning an Azure Storage blob

    Container images are great. We may also want the raw published .NET project package for archival purposes, or to deploy to non-container runtimes. I chose Azure Storage for this purpose.

    I created a blob storage account named seroterbuilds, and then a single blob container named coreapp. This isn’t a Docker container, but just a logical construct to hold blobs.

    Creating an Azure Kubernetes Cluster

    It’s not hard to find a way to run Kubernetes. I think my hair stylist sells a distribution. You can certainly spin up your own vanilla server environment from the OSS bits. Or run it on your desktop with minikube. Or run an enterprise-grade version anywhere with something like VMware PKS. Or run it via managed service with something like Azure Kubernetes Service (AKS).

    AKS is easy to set up, and I provided the version (1.13.9), node pool size, service principal for authentication, and basic HTTP routing for hosted containers. My 3-node cluster was up and running in a few minutes.

    Starting up a Concourse environment

    Finally, Concourse. If you visit the Concourse website, there’s a link to a Docker Compose file you can download and start up via docker-compose up. This starts up the database, worker, and web node components needed to host pipelines.

    Once Concourse is up and running, the web-based Dashboard is available on localhost:8080.

    From there you can find links (bottom left) to downloads for the command line tool (called fly). This is the primary UX for deploying and troubleshooting pipelines.

    With fly installed, we create a “target” that points to our environment. Do this with the following statement. Note that I’m using “rs” (my initials) as the alias, which gets used for each fly command.

    fly -t rs login -c http://localhost:8080

    Once I request a Concourse login (default username is “test” and password is “test”), I’m routed to the dashboard to get a token, which gets loaded automatically into the CLI.

    At this point, we’ve got a functional ASP.NET Core app, a container registry, an object storage destination, a managed Kubernetes environment, and a Concourse. In the next post, we’ll build the first part of our Azure-focused pipeline that reads source code, runs tests, and packages the artifacts.

  • What happens to sleeping instances when you update long-running AWS Lambdas, Azure Functions, and Azure Logic Apps?

    What happens to sleeping instances when you update long-running AWS Lambdas, Azure Functions, and Azure Logic Apps?

    Serverless things don’t always complete their work in milliseconds. With the introduction of AWS Step Functions and Azure Durable Functions, we have compute instances that exist for hours, days, or even months. With serverless workflow tools like Azure Logic Apps, it’s also easy to build long-running processes. So in this world of continuous delivery and almost-too-easy update processes, what happens when you update the underlying definition of things that have running instances? Do they use the version they started with? Do they pick up changes and run with those after waking up? Do they crash and cause the heat death of the universe? I was curious, so I tried it out.

    Azure Durable Functions

    Azure Durable Functions extends “regular” Azure Functions. They introduce a stateful processing layer by defining an “orchestrator” that calls Azure Functions, checkpoints progress, and manages intermediate state.

    Let’s build one, and then update it to see what happens to the running instances.

    First, I created a new Function App in the Azure Portal. A Function App holds individual functions. This one uses the “consumption plan” so I only pay for the time a function runs, and contains .NET-based functions. Also note that it provisions a storage account, which we’ll end up using for checkpointing.

    Durable Functions are made up of a client function that create an orchestration, orchestration functions that coordinate work, and activity functions that actually do the work. From the Azure Portal, I could see a template for creating an HTTP client (or starter) function.

    The function code generated by the template works as-is.

    #r "Microsoft.Azure.WebJobs.Extensions.DurableTask"
    #r "Newtonsoft.Json"
    
    using System.Net;
    
    public static async Task<HttpResponseMessage> Run(
        HttpRequestMessage req,
        DurableOrchestrationClient starter,
        string functionName,
        ILogger log)
    {
        // Function input comes from the request content.
        dynamic eventData = await req.Content.ReadAsAsync<object>();
    
        // Pass the function name as part of the route 
        string instanceId = await starter.StartNewAsync(functionName, eventData);
    
        log.LogInformation($"Started orchestration with ID = '{instanceId}'.");
    
        return starter.CreateCheckStatusResponse(req, instanceId);
    }

    Next I created the activity function. Like with the client function, the Azure Portal generates a working function from the template. It simply takes in a string, and returns a polite greeting.

    #r "Microsoft.Azure.WebJobs.Extensions.DurableTask"
    
    public static string Run(string name)
    {
        return $"Hello {name}!";
    }

    The final step was to create the orchestrator function. The template-generated code is below. Notice that our orchestrator calls the “hello” function three times with three different inputs, and aggregates the return values into a single output.

    #r "Microsoft.Azure.WebJobs.Extensions.DurableTask"
    
    public static async Task<List<string>> Run(DurableOrchestrationContext context)
    {
        var outputs = new List<string>();
    
        outputs.Add(await context.CallActivityAsync<string>("Hello", "Tokyo"));
        outputs.Add(await context.CallActivityAsync<string>("Hello", "Seattle"));
        outputs.Add(await context.CallActivityAsync<string>("Hello", "London"));
    
        // returns ["Hello Tokyo!", "Hello Seattle!", "Hello London!"]
        return outputs;

    After saving this function, I went back to the starter/client function and clicked the “Get function URL” link to get the URL I need to invoke to instantiate this orchestrator. Then, I plugged that into Postman, and submitted a POST request.

    Since the Durable Function is working asynchronously, I get back URIs to check the status, or terminate the orchestrator. I invoked the “get status” endpoint, and saw the aggregated results returned from the orchestrator function.

    So it all worked. Terrific. Next I wanted to add a delay in between activity function calls to simulate a long-running process. What’s interesting with Durable Functions is that every time it gets results back from an async call (or timer), it reruns the entire orchestrator from scratch. Now, it checks the execution log to avoid calling the same operation again, but this made me wonder how it would respond if I added *new* activities in the mix, or deleted activities.

    First, I added some instrumentation to the orchestrator function (and injected function input) so that I could see more about what was happening. In the code below, if we’re not replaying activities (so, first time it’s being called), it traces out a message.

    public static async Task<List<string>> Run(DurableOrchestrationContext context, ILogger log)
    {
        var outputs = new List<string>();
    
        outputs.Add(await context.CallActivityAsync<string>("Hello", "Tokyo"));
        if (!context.IsReplaying) log.LogInformation("Called function once.");
    
        outputs.Add(await context.CallActivityAsync<string>("Hello", "Seattle"));
        if (!context.IsReplaying) log.LogInformation("Called function twice.");
    
        outputs.Add(await context.CallActivityAsync<string>("Hello", "London"));
        if (!context.IsReplaying) log.LogInformation("Called function thrice.");
    
        // returns ["Hello Tokyo!", "Hello Seattle!", "Hello London!"]
        return outputs;
    }

    After saving this update, I triggered the client function again, and with the streaming “Logs” view open in the Portal. Here, I saw trace statements for each call to an activity function.

    A durable function supports Timers that pause processing for up to seven days. I added the following code between the second and third function calls. This pauses the function for 30 seconds.

        if (!context.IsReplaying) log.LogInformation("Starting delay.");
        DateTime deadline = context.CurrentUtcDateTime.Add(TimeSpan.FromSeconds(30));
        await context.CreateTimer(deadline, System.Threading.CancellationToken.None);
        if (!context.IsReplaying) log.LogInformation("Delay finished.");

    If you trigger the client function again, it will take 30-ish seconds to get results back, as expected.

    Next I tested three scenarios to see how Durable Functions handled them:

    1. Wait until the orchestrator hits the timer, and change the payload for an activity function call that executed before the timer started. What happens when the framework tries to re-run a step that’s changed? I changed the first function’s payload from “Tokyo” to “Mumbai” after the function instance had already passed the first call, and was paused at the timer. After the function resumed from the timer, the orchestrator failed with a message of: “Non-Deterministic workflow detected: TaskScheduledEvent: 0 TaskScheduled Hello.” Didn’t like that. Changing the call signature, or apparently even the payload is a no-no if you don’t want to break running instances.
    2. Wait until the orchestrator hits the timer, and update the function to introduce a new activity function call in code above the timer. Does the framework execute that new function call when it wakes up and re-runs, or ignore it? Indeed, it runs it. So after the timer wrapped up, the NEW, earlier function call got invoked, AND it ran the timer again before continuing. That part surprised me, and it only kinda worked. Instead of returning the expected value from the activity function, I got a “2” back. And some times when I tested this, I got the above “non-deterministic workflow” error. So, your mileage may vary.
    3. Add an activity call after the timer, and see if it executes it after the delay is over. Does the orchestrator “see” the new activity call I added to the code after it woke back up? The first time I tried this, I again got the “non-deterministic workflow” error, but with a few more tests, I saw it actually executed the new function after waking back up, AND running the timer a second time.

    What have we learned? The “version” a Durable Function starts with isn’t serialized and used for the entirety of the execution. It’s picking up things changing along the way. Be very aware of side effects! For a number of these tests, I also had to “try again” and would see different results. I feel like I was breaking Azure Functions!

    What’s the right way to version these? Microsoft offers some advice, which ranges from “do nothing and let things fail” to “deploy an entirely new function.” But from these tests, I’d advise against changing function definitions outside of explicitly deploying new versions.

    Azure Logic Apps

    Let’s take a look at Logic Apps. This managed workflow service is designed for constructing processes that integrate a variety of sources and targets. It supports hundreds of connectors to things likes Salesforce.com, Amazon Redshift, Slack, OneDrive, and more. A Logic App can run for 90 days in the multi-tenant environment, and up to a year in the dedicated environment. So, most users of Logic Apps are going to have instances in-flight when it comes time to deploy updates.

    To test this out, I first created a couple of Azure Functions that Logic Apps could call. These JavaScript functions are super lame, and just return a greeting.

    Next up, I created a Logic App. It’s easy.

    After a few moments, I could jump in and start designing my workflow. As a “serverless” service, Logic Apps only run when invoked, and start with a trigger. I chose the HTTP trigger.

    My Logic App takes in an HTTP request, has a 45 second “delay” (which could represent waiting for new input, or a long-running API call) before invoke our simple Azure Function.

    I saved the Logic App, called the HTTP endpoint via Postman, and waited. After about 45 seconds, I saw that everything succeeded.

    Next, I kicked off another instance, and quickly went in and added another Function call after the first one. What would Logic Apps do with that after the delay was over? It ignored the new function call. Then I kicked off another Logic Apps instance, and quickly deleted the second function call. Would the instance wake up and now only call one Function? Nope, it called them both.

    So it appears that Logic Apps snapshot the workflow when it starts, and it executes that version, regardless of what changes in the underlying definition after the fact. That seems good. It results in a more consistent, predictable process. Logic Apps does have the concept of versioning, and you can promote previous versions to the active one as needed.

    AWS Step Functions

    AWS doesn’t have something exactly like Logic Apps, but AWS Step Functions is somewhat similar to Azure Durable Functions. With Step Functions, you can chain together a series of AWS services into a workflow. It basically builds a state machine that you craft in their JSON-based Amazon State Language. A given Step Function can be idle for up to a year, so again. you’ll probably have long-running instances going at all times!

    I jumped into the AWS console and started with their “hello world” template.

    This state machine has a couple basic states that execute immediately. Then I added a 20 second wait.

    After deploying the Step Function, it was easy to see that it ran everything quickly and successfully.

    Next, I kicked off a new instance, and added a new step to the state machine while the instance was waiting. The Step Function that was running ignored it.

    When I kicked off another Step Function and removed the step after the wait step, it also ignored it. It seems pretty clear that AWS Step Functions snapshot the workflow at the start proceed with that snapshot, even if the underlying definition changes. I didn’t find much documentation around formally versioning Step Functions, but it seems to keep you fairly safe from side effects.

    With all of these, it’s important to realize that you also have to consider versioning of downstream calls. I could have an unchanged Logic App, but the function or API it invokes had its plumbing entirely updated after the Logic App started running. There’s no way to snapshot the state of all the dependencies! That’s normal in a distributed system. But, something to remember.

    Have you observed any different behavior with these stateful serverless products?

  • Which of the 295,680 platform combinations will you create on Microsoft Azure?

    Which of the 295,680 platform combinations will you create on Microsoft Azure?

    Microsoft Azure isn’t a platform. Like every other public cloud, it’s an environment and set of components you’ll use to construct your platform. It’s more like an operating system that you build on, versus some integrated product you just start using. And that’s exciting. Which platform will you create? Let’s look at what a software platform is, how I landed on 295,680 unique configurations — 10,036,224,000 configurations if you add a handful of popular 3rd party products — and the implications of all this.

    What’s a software platform?

    Let’s not overthink this. When I refer to a software platform, I’m thinking of the technologies that come together to help you deploy, run, and manage software. This applies whether we’re talking about stuff in your data center or in the public cloud. It applies to serverless systems or good ol’ virtual machines.

    I made a map of the non-negotiable capabilities. One way or another, you’re stitching these things together. You need an app runtime (e.g. VMs, FaaS, containers), databases, app deployment tools, infrastructure/config management, identity systems, networking, monitoring, and more. Pretty much all your running systems depend on this combination of things.

    How many platform combinations are there in Microsoft Azure?

    I’m not picking on Microsoft here; you face the same decision points in every cloud. Each customer realistically, each tenant in your account chooses among the various services to assemble the platform they want. Let’s first talk about only using Microsoft’s first-party services. So, assume you aren’t using any other commercial or OSS products to build and run your systems. Unlikely, but hey, work with me here.

    For math purposes, let’s calculate unique combinations by assuming your platform uses one thing from each category. The exception? App runtimes and databases. I think it’s more likely you’re using at least a pair of runtimes (e.g. Azure App Service AND Azure Kubernetes Service, or, Windows VMs AND Linux VMs), and a pair of databases. You may be using more, but I’m being conservative.

    295,680 unique platforms you can build on Azure using only native services. Ok, that’s a lot. Now that said, I suspect it’s VERY unlikely you’ll only use native cloud services to build and run software. You might love using Terraform to deploy infrastructure. Or MongoDB Atlas for a managed MongoDB environment. Kong may offer your API gateway of choice. Maybe Prometheus is your standard for monitoring. And don’t forget about all the cool managed services like Twilio, Auth0, or Algolia. The innovation outside of any one cloud will always be greater than the innovation within that cloud. You want in on some of that action! So what happens if I add just a few leading non-Azure services to your platform?

    Yowza. 10 billion platform combinations. You can argue with my math or approach, but hopefully you get my point.

    And again, this really isn’t about any particular cloud. You can end up in the same place on AWS, Digital Ocean, or Alibaba. It’s simply the result of all the amazing choices we have today.

    Who cares?

    If you’re working at a small company, or simply an individual using cloud services, this doesn’t really matter. You’ll choose the components that help you deliver software best, and go with it.

    Where this gets interesting is in the enterprise. You’ve got many distinct business units, lots of existing technology in use, and different approaches to using cloud computing. Done poorly, your cloud environment stands to be less secure, harder to maintain, and more chaotic than anything you have today. Done well, your cloud environment will accelerate time-to-market and lower your infrastructure costs so that you can spend more time building software your customers love.

    My advice? Decide on your tenancy model up-front, and purposely limit your choices.

    In the public cloud, you can separate user pools (“tenants”) in at least three different ways:

    1. Everyone in one account. Some companies start this way, and use role-based access or other in-account mechanisms (e.g. resource groups) to silo individual groups or apps. On the positive side, this model is easier to audit and developers can easily share access to services. Challenges here include a bigger blast radius for mistakes, and greater likelihood of broad processes (e.g. provisioning or policy changes) that slow individuals down.
    2. Separate-but-equal sub accounts. I’ve seen some large companies use child accounts or subscriptions for each individual tenant. Each tenant’s account is set up in the same way, with access to the same services. Every tenant owns their own resources, but they operate a standard “platform.” On the plus side, this makes it easier to troubleshoot problems across the org, and enforce a consistent security profile. It also makes engineer rotation easier, since each team has the same stack. On the downside, this model doesn’t account for unique needs of each team and may force suboptimal tech choices in the name of consistency.
    3. Independent sub accounts. A few weeks ago, I watched my friend Brian Chambers explain that each of 30 software teams at Chick-fil-A has their own AWS account, with a recommended configuration that tenants can use, modify, or ignore. Here, every tenant can do their own thing. One of the benefits is that each group can cater their platform to their needs. If a team wants to go entirely serverless, awesome. Another may be all in on Kubernetes. The downside of this model is that you can’t centralize things like security patching, and you can end up with snowflake environments that increase your costs over time.

    Finally, it’s wise to purposely limit choices. I wrote about this topic last month. Facing too many choices can paralyze you, and all that choice adds only incremental benefits. For mature categories like databases, pick two and stop there. If it’s an emerging space, offer more freedom until commoditization happens. Give your teams some freedom to build their platform on the public cloud, but put some guardrails in place.

  • My new Pluralsight course about serverless computing is now available

    My new Pluralsight course about serverless computing is now available

    Serverless computing. Let’s talk about it. I don’t think it’s crazy to say that it represents the first cloud-native software model. Done right, it is inherently elastic and pay-per-use, and strongly encourages the use of cloud managed services. And to be sure, it’s about much more than just Function-as-a-Service platforms like AWS Lambda.

    So, what exactly is it, why does it matter, and what technologies and architecture patterns should you know? To answer that question, I spent a few months researching the topic, and put together a new Pluralsight course, Serverless Computing: The Big Picture.

    The course is only an hour long, but I get into some depth on benefits, challenges, and patterns you should know.

    The first module looks at the various serverless definitions offered by industry experts, why serverless is different from what came before it, how serverless compares to serverful systems, challenges you may face adopting it, and example use cases.

    The second module digs into the serverless tech that matters. I look at public cloud function-as-a-service platforms, installable platforms, dev tools, and managed services.

    The final module of the course looks at architecture patterns. We start by looking at best practices, then review a handful of patterns.

    As always, I had fun putting this together. It’s my 19th Pluralsight course, and I don’t see stopping any time soon. If you watch it, I’d love your feedback. I hope it helps you get a handle on this exciting, but sometimes-confusing, topic!