Category: Docker

  • Measuring container size and startup latency for serverless apps written in C#, Node.js, Go, and Java

    Measuring container size and startup latency for serverless apps written in C#, Node.js, Go, and Java

    Do you like using function-as-a-service (FaaS) platforms to quickly build scalable systems? Me too. There are constraints around what you can do with FaaS, which is why I also like this new crop of container-based serverless compute services. These products—the terrific Google Cloud Run is the most complete example and has a generous free tier—let you deploy more full-fledged “apps” versus the glue code that works best in FaaS. Could be a little Go app, full-blown Spring Boot REST API, or a Redis database. Sounds good, but what if you don’t want to mess with containers as you build and deploy software? Or are concerned about the “cold start” penalty of a denser workload?

    Google Cloud has embraced Cloud Buildpacks as a way to generate a container image from source code. Using our continuous integration service or any number of compute services directly, you never have to write a Dockerfile again, unless you want to. Hopefully, at least. Regarding the cold start topic, we just shipped a new cloud metric, “container startup latency” to measure the time it takes for a serverless instance to fire up. That seems like a helpful tool to figure out what needs to be optimized. Based on these two things, I got curious and decided to build the same REST API in four different programming languages to see how big the generated container image was, and how fast the containers started up in Cloud Run.

    Since Cloud Run accepts most any container, you have almost limitless choices in programming language. For this example, I chose to use C#, Go, Java (Spring Boot), and JavaScript (Node.js). I built an identical REST API with each. It’s entirely possible, frankly likely, that you could tune these apps much more than I did. But this should give us a decent sense of how each language performs.

    Let’s go language-by-language and review the app, generate the container image, deploy to Cloud Run, and measure the container startup latency.

    Go

    I’m almost exclusively coding in Go right now as I try to become more competent with it. Go has an elegant simplicity to it that I really enjoy. And it’s an ideal language for serverless environments given its small footprint, blazing speed, and easy concurrency.

    For the REST API, which basically just returns a pair of “employee” records, I used the Echo web framework and Go 1.18.

    My data model (struct) has four properties.

    package model
    
    type Employee struct {
    	Id       string `json:"id"`
    	FullName string `json:"fullname"`
    	Location string `json:"location"`
    	JobTitle string `json:"jobtitle"`
    }
    

    My web handler offers a single operation that returns two employee items.

    package web
    
    import (
    	"net/http"
    
    	"github.com/labstack/echo/v4"
    	"seroter.com/restapi/model"
    )
    
    func GetAllEmployees(c echo.Context) error {
    
    	emps := [2]model.Employee{{Id: "100", FullName: "Jack Donaghy", Location: "NYC", JobTitle: "Executive"}, {Id: "101", FullName: "Liz Lemon", Location: "NYC", JobTitle: "Writer"}}
    	return c.JSON(http.StatusOK, emps)
    }
    

    And finally, the main Go class spins up the web server.

    package main
    
    import (
    	"fmt"
    
    	"github.com/labstack/echo/v4"
    	"github.com/labstack/echo/v4/middleware"
    	"seroter.com/restapi/web"
    )
    
    func main() {
    	fmt.Println("server started ...")
    
    	e := echo.New()
    	e.Use(middleware.Logger())
    
    	e.GET("/employees", web.GetAllEmployees)
    
    	e.Start(":8080")
    }
    

    Next, I used Google Cloud Build along with Cloud Buildpacks to generate a container image from this Go app. The buildpack executes a build, brings in a known good base image, and creates an image that we add to Google Cloud Artifact Registry. It’s embarrassingly easy to do this. Here’s the single command with our gcloud CLI:

    gcloud builds submit --pack image=gcr.io/seroter-project-base/go-restapi 
    

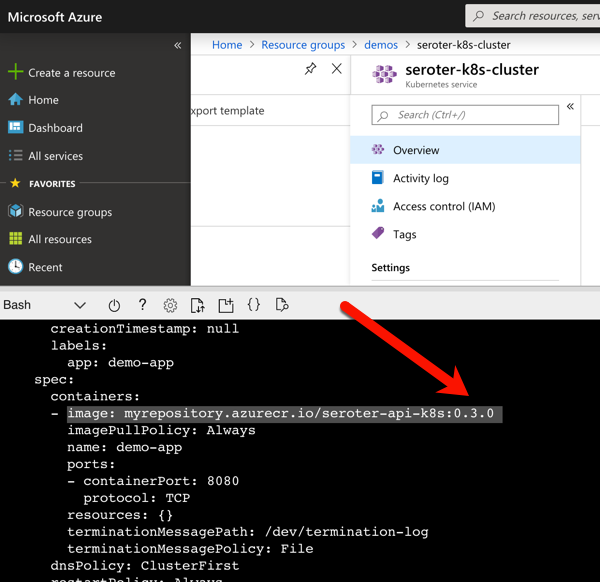
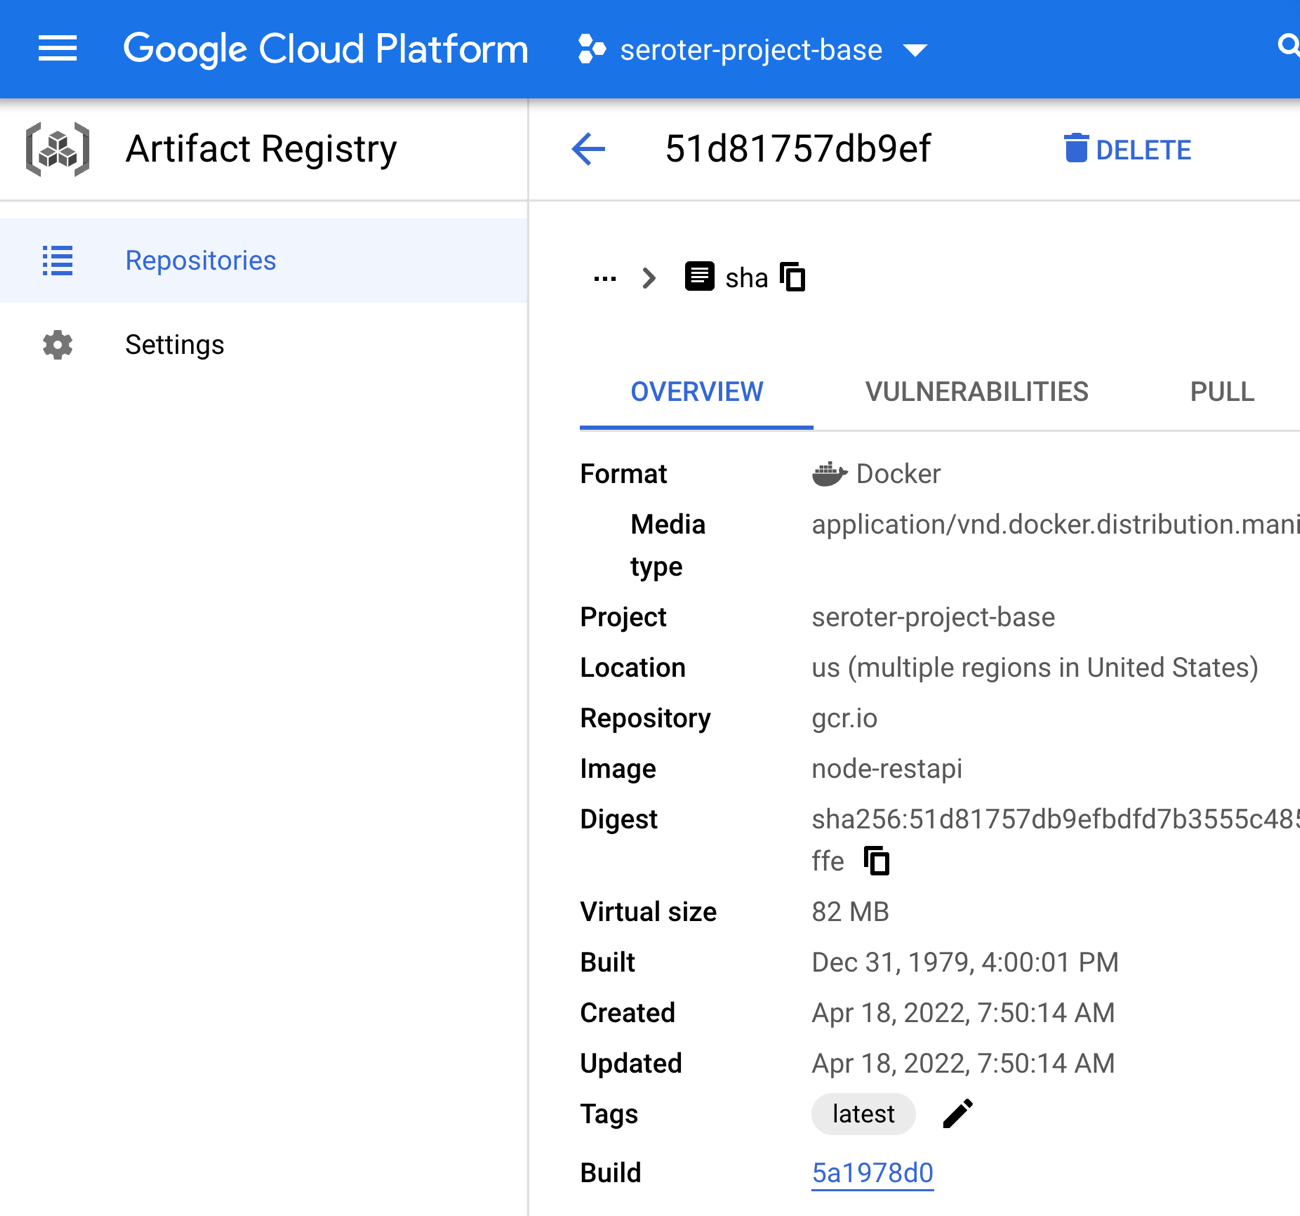
    The result? A 51.7 MB image in my Docker repository in Artifact Registry.

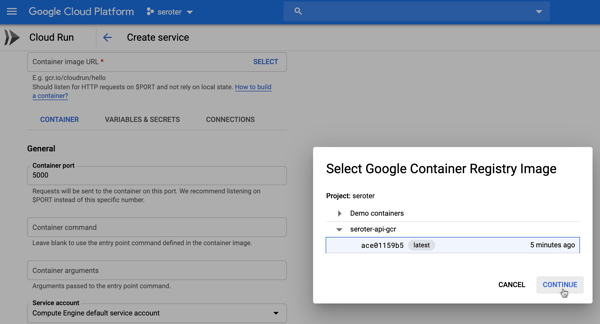
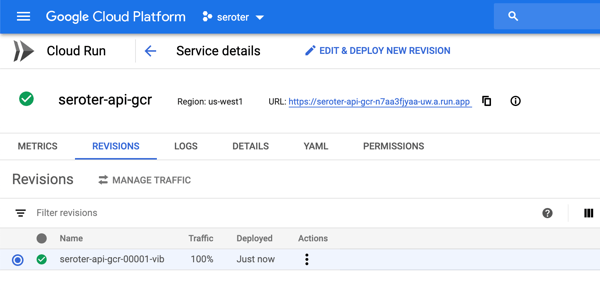
    The last step was to deploy to Cloud Run. We could use the CLI of course, but let’s use the Console experience because it’s delightful.

    After pointing at my generated container image, I could just click “create” and accept all the default instance properties. As you can see below, I’ve got easy control over instance count (minimum of zero, but you can keep a warm instance running if you want).

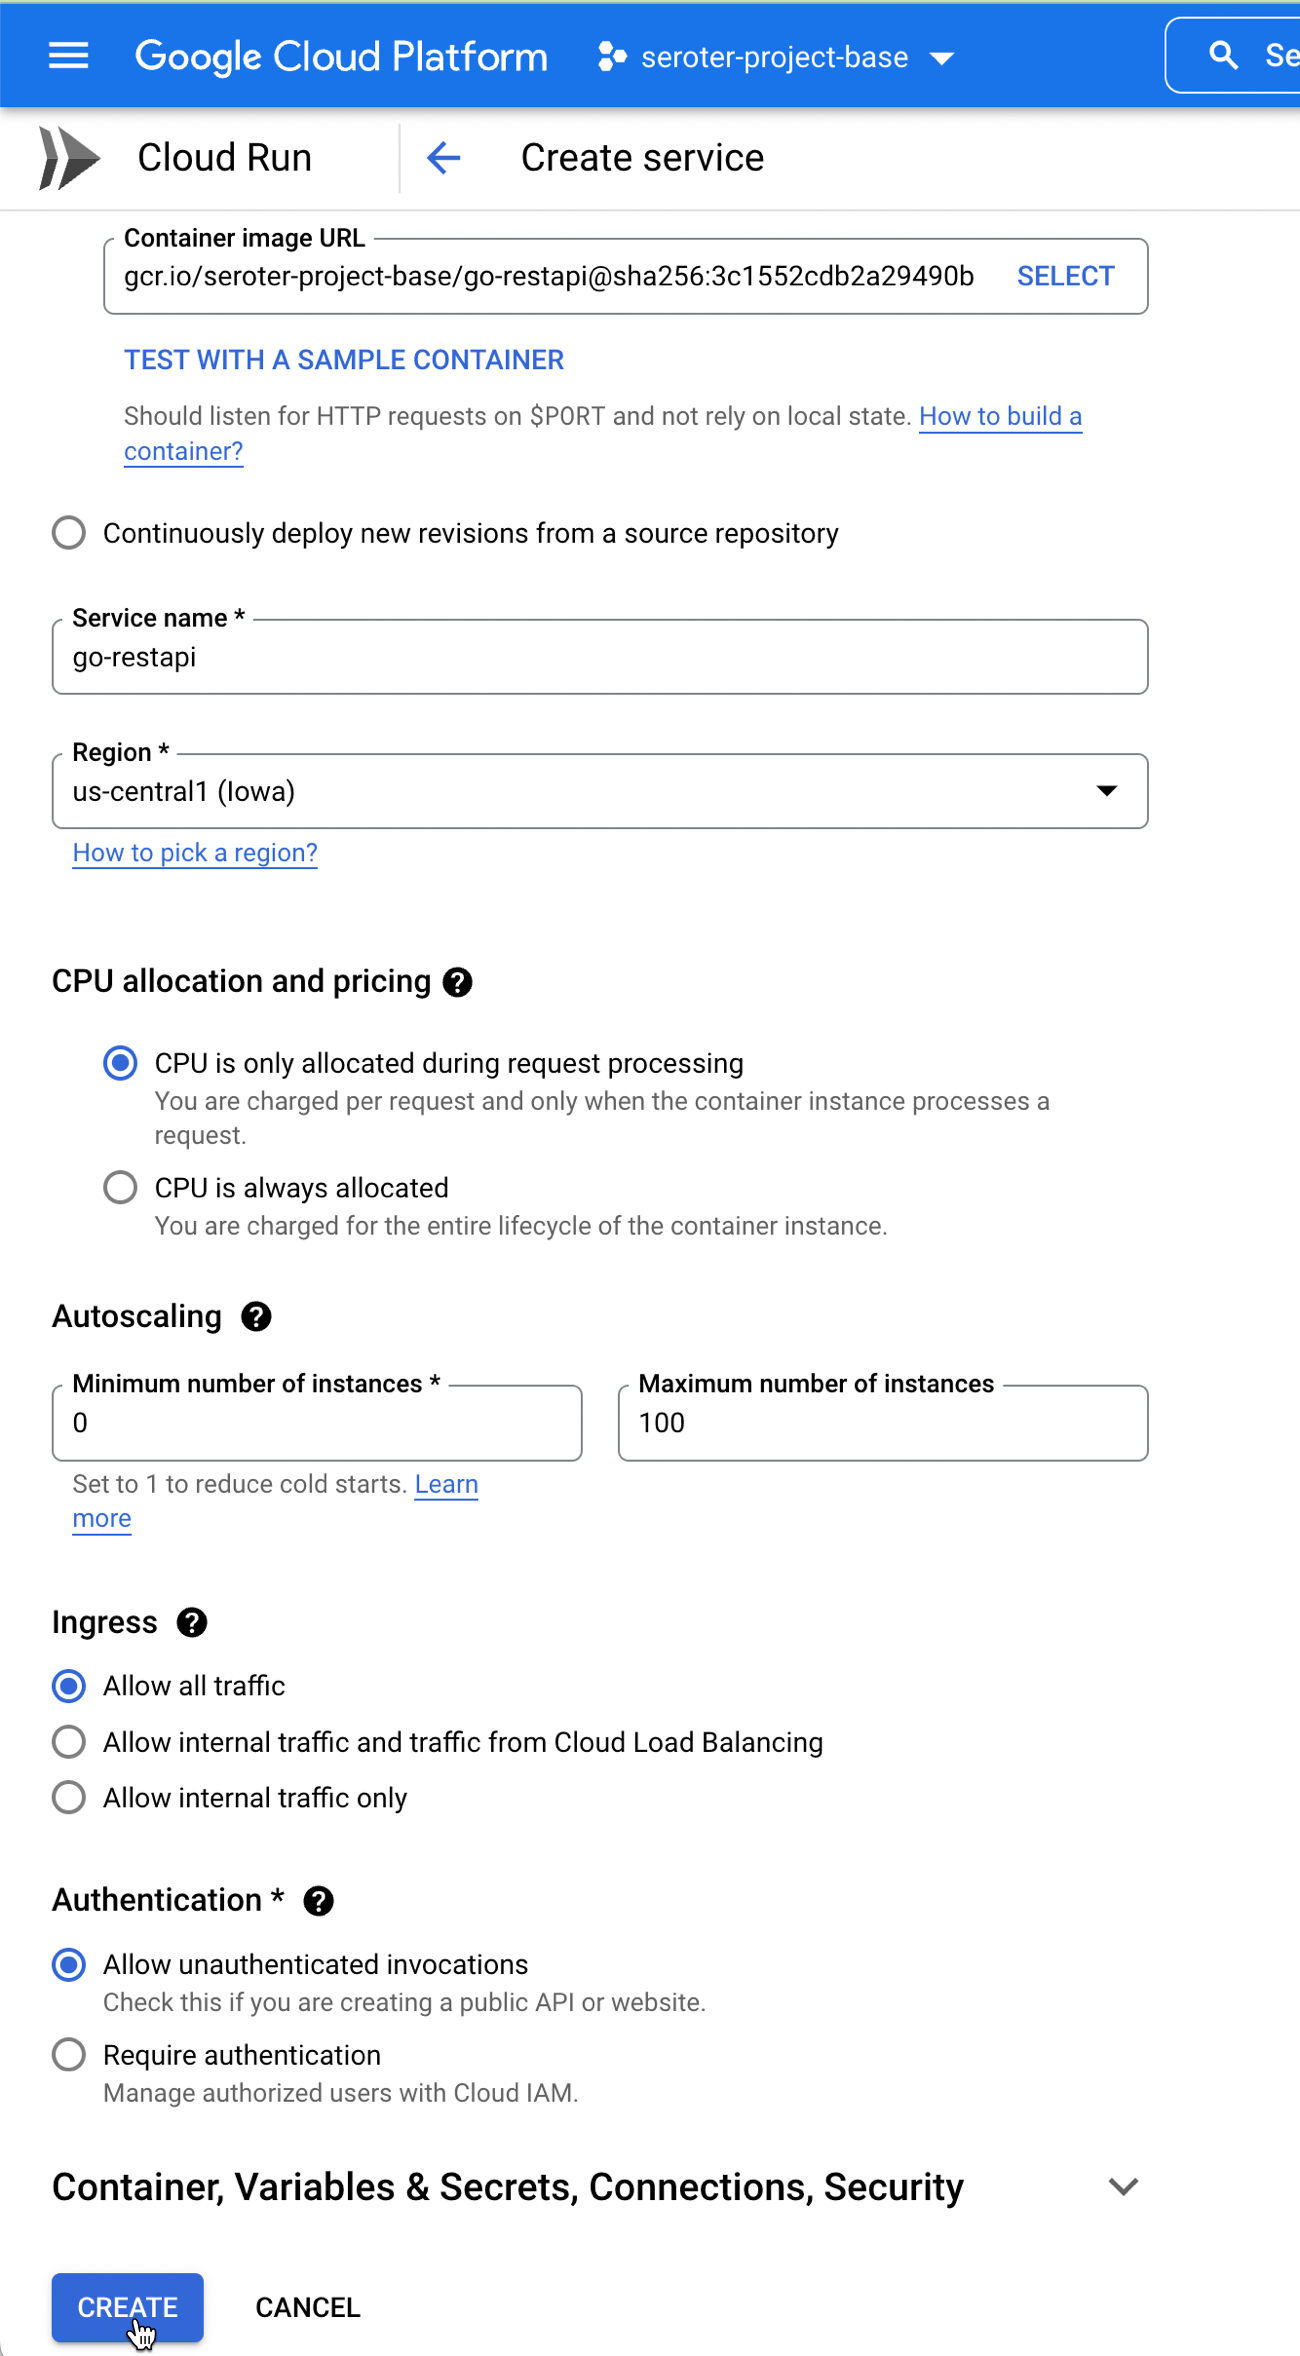
    Let’s tweak a couple of things. First off, I don’t need the default amount of RAM. I can easily operate with just 256MiB, or even less. Also, you see here that we default to 80 concurrent requests per container. That’s pretty cool, as most FaaS platforms do a single concurrent request. I’ll stick with 80.

    It seriously took four seconds from the time I clicked “create” until the instance was up and running and able to take traffic. Bonkers. I didn’t send any initial requests in, as I want to hit it cold with a burst of data. I’m using the excellent hey tool to generate a bunch of load on my service. This single command sends 200 total requests, with 10 concurrent workers.

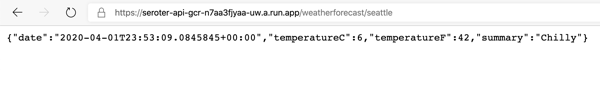
    hey -n 200 -c 10 https://go-restapi-ofanvtevaa-uc.a.run.app/employees
    

    Here’s the result. All the requests were done in 2.6 seconds, and you can see that that the first ones (as the container warmed up) took 1.2 seconds, and the vast majority took 0.177 seconds. That’s fast.

    Summary:
      Total:        2.6123 secs
      Slowest:      1.2203 secs
      Fastest:      0.0609 secs
      Average:      0.1078 secs
      Requests/sec: 76.5608
      
      Total data:   30800 bytes
      Size/request: 154 bytes
    
    Response time histogram:
      0.061 [1]     |
      0.177 [189]   |■■■■■■■■■■■■■■■■■■■■■■■■■■■■■■■■■■■■■■■■
      0.293 [0]     |
      0.409 [0]     |
      0.525 [1]     |
      0.641 [6]     |■
      0.757 [0]     |
      0.873 [0]     |
      0.988 [0]     |
      1.104 [0]     |
      1.220 [3]     |■
    
    
    Latency distribution:
      10% in 0.0664 secs
      25% in 0.0692 secs
      50% in 0.0721 secs
      75% in 0.0777 secs
      90% in 0.0865 secs
      95% in 0.5074 secs
      99% in 1.2057 secs

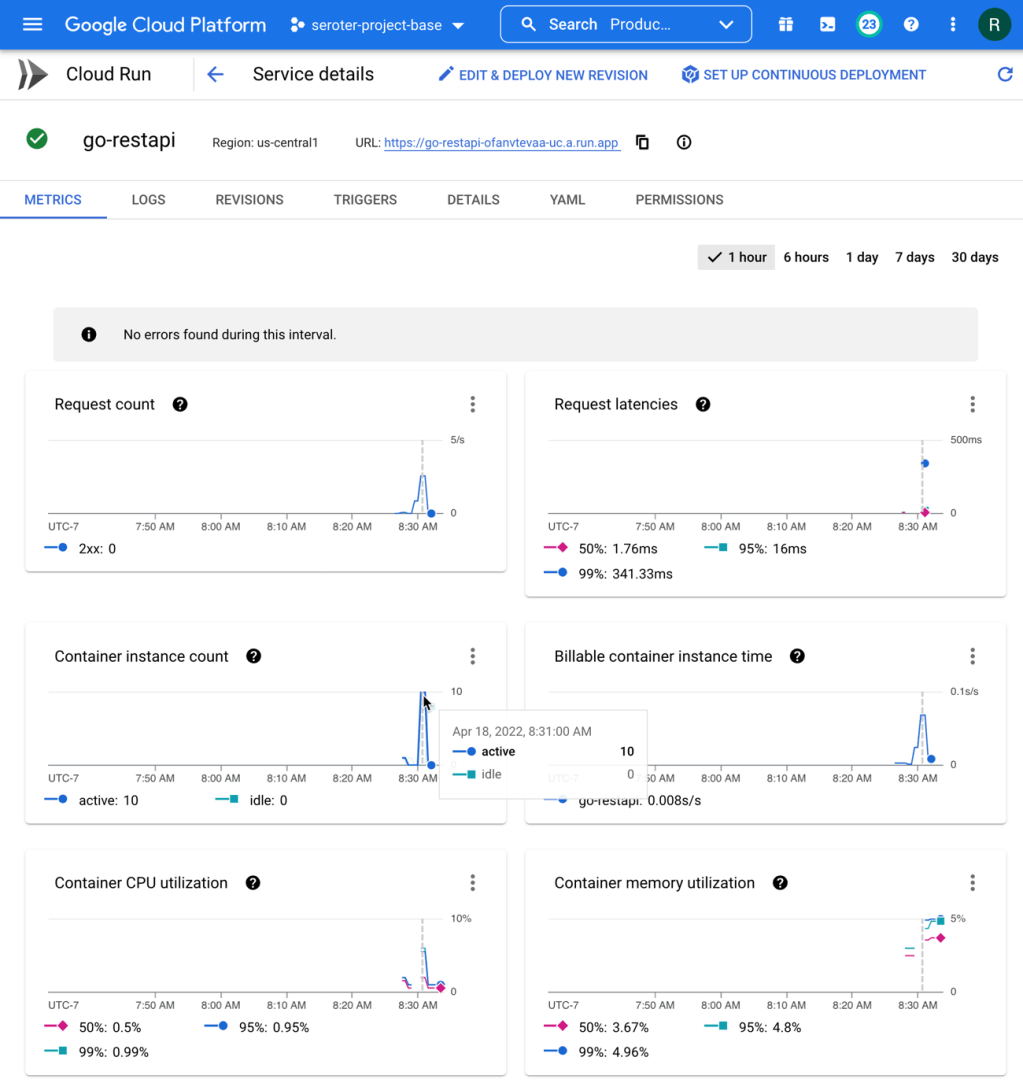
    How about the service metrics? I saw that Cloud Run spun up 10 containers to handle the incoming load, and my containers topped out at 5% memory utilization. It also barely touched the CPU.

    How about that new startup latency metric? I jumped into Cloud Monitoring directly to see that. There are lots of ways to aggregate this data (mean, standard deviation, percentile) and I chose the 95th percentile. My container startup time is pretty darn fast (at 95th percentile, it’s 106.87 ms), and then stays up to handle the load, so I don’t incur a startup cost for the chain of requests.

    Finally, with some warm instances running, I ran the load test again. You can see how speedy things are, with virtually no “slow” responses. Go is an excellent choice for your FaaS or container-based workloads if speed matters.

    Summary:
      Total:        2.1548 secs
      Slowest:      0.5008 secs
      Fastest:      0.0631 secs
      Average:      0.0900 secs
      Requests/sec: 92.8148
      
      Total data:   30800 bytes
      Size/request: 154 bytes
    
    Response time histogram:
      0.063 [1]     |
      0.107 [185]   |■■■■■■■■■■■■■■■■■■■■■■■■■■■■■■■■■■■■■■■■
      0.151 [2]     |
      0.194 [10]    |■■
      0.238 [0]     |
      0.282 [0]     |
      0.326 [0]     |
      0.369 [0]     |
      0.413 [0]     |
      0.457 [1]     |
      0.501 [1]     |
    
    
    Latency distribution:
      10% in 0.0717 secs
      25% in 0.0758 secs
      50% in 0.0814 secs
      75% in 0.0889 secs
      90% in 0.1024 secs
      95% in 0.1593 secs
      99% in 0.4374 secs

    C# (.NET)

    Ah, .NET. I started using it with the early preview release in 2000, and considered myself a (poor) .NET dev for most of my career. Now, I dabble. .NET 6 looks good, so I built my REST API with that.

    Update: I got some good feedback from folks that I could have tried this .NET app using the new minimal API structure. I wasn’t sure it’d make a difference, but tried it anyway. Resulted in the same container size, and roughly the same response time (4.2088 seconds for all 200 requests) and startup latency (2.23s at 95th percentile). Close, but actually a tad slower! On the second pass of 200 requests, the total response time was almost equally (1.6915 seconds) fast as the way I originally wrote it.

    My Employee object definition is straightforward.

    namespace dotnet_restapi;
    
    public class Employee {
    
        public Employee(string id, string fullname, string location, string jobtitle) {
            this.Id = id;
            this.FullName = fullname;
            this.Location = location;
            this.JobTitle = jobtitle;
        }
    
        public string Id {get; set;}
        public string FullName {get; set;}
        public string Location {get; set;}
        public string JobTitle {get; set;}
    }
    

    The Controller has a single operation and returns a List of employee objects.

    using Microsoft.AspNetCore.Mvc;
    
    namespace dotnet_restapi.Controllers;
    
    [ApiController]
    [Route("[controller]")]
    public class EmployeesController : ControllerBase
    {
    
        private readonly ILogger<EmployeesController> _logger;
    
        public EmployeesController(ILogger<EmployeesController> logger)
        {
            _logger = logger;
        }
    
        [HttpGet(Name = "GetEmployees")]
        public IEnumerable<Employee> Get()
        {
            List<Employee> emps = new List<Employee>();
            emps.Add(new Employee("100", "Bob Belcher", "SAN", "Head Chef"));
            emps.Add(new Employee("101", "Philip Frond", "SAN", "Counselor"));
    
            return emps;
        }
    }
    

    The program itself simply looks for an environment variable related to the HTTP port, and starts up the server. Much like above, to build this app and produce a container image, it only takes this one command:

    gcloud builds submit --pack image=gcr.io/seroter-project-base/dotnet-restapi 
    

    The result is a fairly svelte 90.6 MB image in the Artifact Registry.

    When deploying this instance to Cloud Run, I kept the same values as with the Go service, as my .NET app doesn’t need more than 256MiB of memory.

    In just a few seconds, I had the app up and running.

    Let’s load test this bad boy and see what happens. I sent in the same type of request as before, with 200 total requests, 10 concurrent.

    hey -n 200 -c 10 https://dotnet-restapi-ofanvtevaa-uc.a.run.app/employees
    

    The results were solid. You can see a total execution time of about 3.6 seconds, with a few instances taking 2 seconds, and the rest coming back super fast.

    Summary:
      Total:        3.6139 secs
      Slowest:      2.1923 secs
      Fastest:      0.0649 secs
      Average:      0.1757 secs
      Requests/sec: 55.3421
      
    
    Response time histogram:
      0.065 [1]     |
      0.278 [189]   |■■■■■■■■■■■■■■■■■■■■■■■■■■■■■■■■■■■■■■■■
      0.490 [0]     |
      0.703 [0]     |
      0.916 [0]     |
      1.129 [0]     |
      1.341 [0]     |
      1.554 [0]     |
      1.767 [0]     |
      1.980 [0]     |
      2.192 [10]    |■■
    
    
    Latency distribution:
      10% in 0.0695 secs
      25% in 0.0718 secs
      50% in 0.0747 secs
      75% in 0.0800 secs
      90% in 0.0846 secs
      95% in 2.0365 secs
      99% in 2.1286 secs

    I checked the Cloud Run metrics, and see that request latency was high on a few requests, but the majority were fast. Memory was around 30% utilization. Very little CPU consumption.

    For container startup latency, the number was 1.492s at the 95th percentile. Still not bad.

    Oh, and sending in another 200 requests with my .NET containers warmed up resulted in some smokin’ fast responses.

    Summary:
      Total:        1.6851 secs
      Slowest:      0.1661 secs
      Fastest:      0.0644 secs
      Average:      0.0817 secs
      Requests/sec: 118.6905
      
    
    Response time histogram:
      0.064 [1]     |
      0.075 [64]    |■■■■■■■■■■■■■■■■■■■■■■■■■
      0.085 [104]   |■■■■■■■■■■■■■■■■■■■■■■■■■■■■■■■■■■■■■■■■
      0.095 [18]    |■■■■■■■
      0.105 [2]     |■
      0.115 [1]     |
      0.125 [0]     |
      0.136 [0]     |
      0.146 [0]     |
      0.156 [0]     |
      0.166 [10]    |■■■■
    
    
    Latency distribution:
      10% in 0.0711 secs
      25% in 0.0735 secs
      50% in 0.0768 secs
      75% in 0.0811 secs
      90% in 0.0878 secs
      95% in 0.1600 secs
      99% in 0.1660 secs

    Java (Spring Boot)

    Now let’s try it with a Spring Boot application. I learned Spring when I joined Pivotal, and taught a couple Pluralsight courses on the topic. Spring Boot is a powerful framework, and you can build some terrific apps with it. For my REST API, I began at start.spring.io to generate my reactive web app.

    The “employee” definition should look familiar at this point.

    package com.seroter.springrestapi;
    
    public class Employee {
    
        private String Id;
        private String FullName;
        private String Location;
        private String JobTitle;
        
        public Employee(String id, String fullName, String location, String jobTitle) {
            Id = id;
            FullName = fullName;
            Location = location;
            JobTitle = jobTitle;
        }
        public String getId() {
            return Id;
        }
        public String getJobTitle() {
            return JobTitle;
        }
        public void setJobTitle(String jobTitle) {
            this.JobTitle = jobTitle;
        }
        public String getLocation() {
            return Location;
        }
        public void setLocation(String location) {
            this.Location = location;
        }
        public String getFullName() {
            return FullName;
        }
        public void setFullName(String fullName) {
            this.FullName = fullName;
        }
        public void setId(String id) {
            this.Id = id;
        }
    }
    

    Then, my Controller + main class exposes a single REST endpoint and returns a Flux of employees.

    package com.seroter.springrestapi;
    
    import java.util.ArrayList;
    import java.util.List;
    
    import org.springframework.boot.SpringApplication;
    import org.springframework.boot.autoconfigure.SpringBootApplication;
    import org.springframework.web.bind.annotation.GetMapping;
    import org.springframework.web.bind.annotation.RestController;
    
    import reactor.core.publisher.Flux;
    
    @RestController
    @SpringBootApplication
    public class SpringRestapiApplication {
    
    	public static void main(String[] args) {
    		SpringApplication.run(SpringRestapiApplication.class, args);
    	}
    
    	List<Employee> employees;
    
    	public SpringRestapiApplication() {
    		employees = new ArrayList<Employee>();
    		employees.add(new Employee("300", "Walt Longmire", "WYG", "Sheriff"));
    		employees.add(new Employee("301", "Vic Moretti", "WYG", "Deputy"));
    
    	}
    
    	@GetMapping("/employees")
    	public Flux<Employee> getAllEmployees() {
    		return Flux.fromIterable(employees);
    	}
    }
    

    I could have done some more advanced configuration to create a slimmer JAR file, but I wanted to try this with the default experience. Once again, I used a single Cloud Build command to generate a container from this app. I do appreciate how convenient this is!

    gcloud builds submit --pack image=gcr.io/seroter-project-base/spring-restapi 
    

    Not surpassingly, a Java container image is a bit hefty. This one clocks in at 249.7 MB in size. The container image size doesn’t matter a TON to Cloud Run, as we do image streaming from Artifact Registry which means only files loaded by your app need to be pulled. But, size still does matter a bit here.

    When deploying this image to Cloud Run, I did keep the default 512 MiB of memory in place as a Java app can tend to consume more resources. The service still deployed in less than 10 seconds, which is awesome. Let’s flood it with traffic.

    hey -n 200 -c 10 https://spring-restapi-ofanvtevaa-uc.a.run.app/employees
    

    200 requests to my Spring Boot endpoint did ok. Clearly there’s a big startup time on the first one(s), and as a developer, that’d be where I dedicate extra time to optimizing.

    Summary:
      Total:        13.8860 secs
      Slowest:      12.3335 secs
      Fastest:      0.0640 secs
      Average:      0.6776 secs
      Requests/sec: 14.4030
      
    
    Response time histogram:
      0.064 [1]     |
      1.291 [189]   |■■■■■■■■■■■■■■■■■■■■■■■■■■■■■■■■■■■■■■■■
      2.518 [0]     |
      3.745 [0]     |
      4.972 [0]     |
      6.199 [0]     |
      7.426 [0]     |
      8.653 [0]     |
      9.880 [0]     |
      11.107 [0]    |
      12.333 [10]   |■■
    
    
    Latency distribution:
      10% in 0.0723 secs
      25% in 0.0748 secs
      50% in 0.0785 secs
      75% in 0.0816 secs
      90% in 0.0914 secs
      95% in 11.4977 secs
      99% in 12.3182 secs

    The initial Cloud Run metrics show fast request latency (routing to the service), 10 containers to handle the load, and a somewhat-high CPU and memory load.

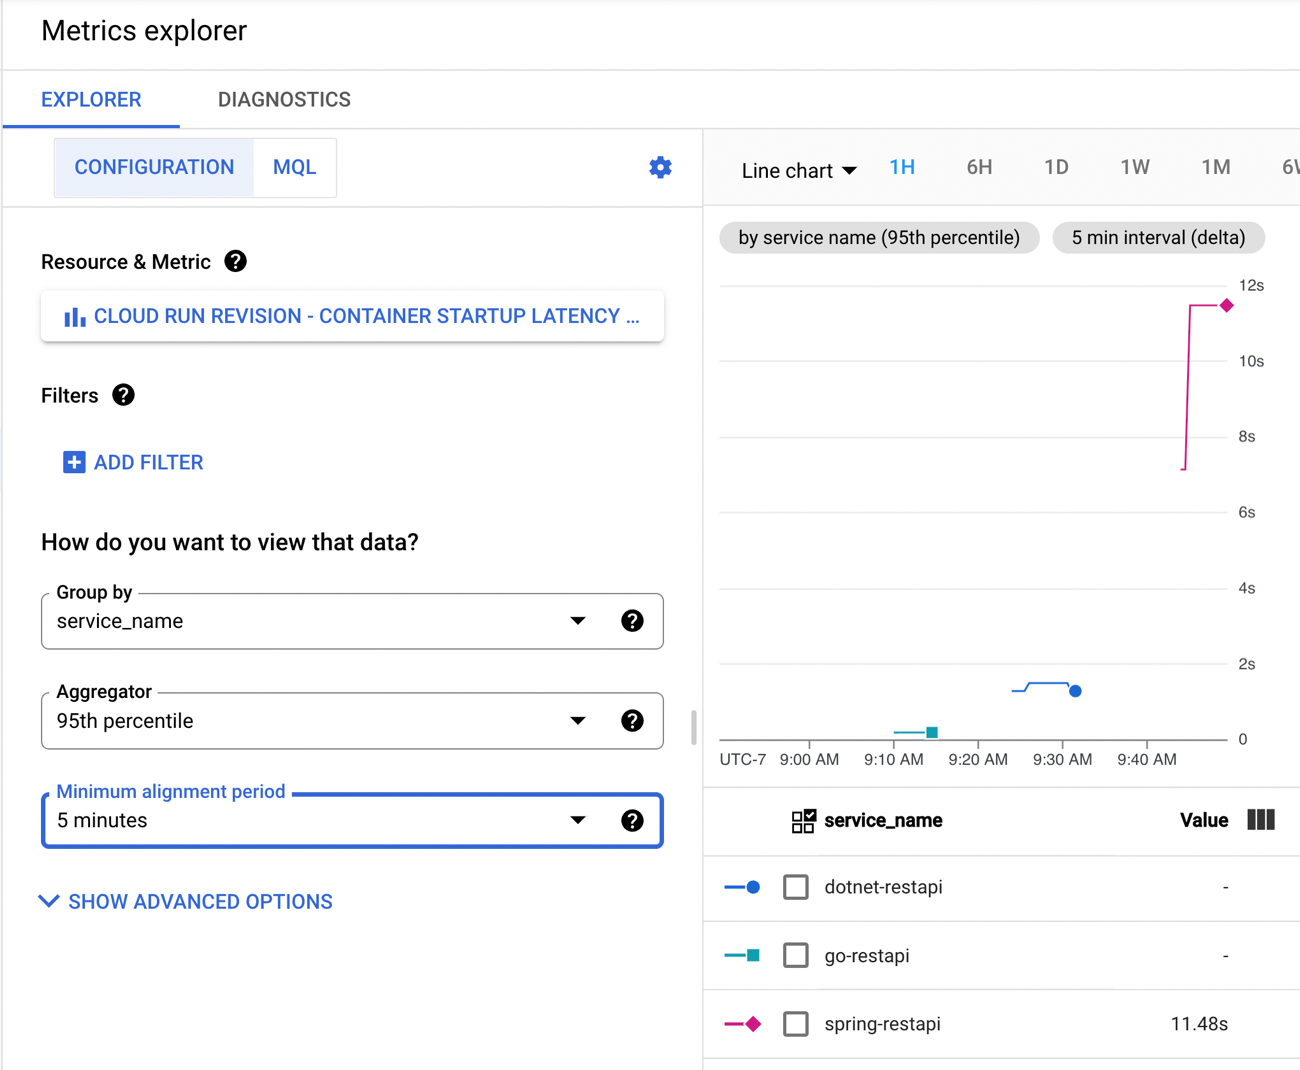
    Back in Cloud Monitoring, I saw that the 95th percentile for container startup latency was 11.48s.

    If you’re doing Spring Boot with serverless runtimes, you’re going to want to pay special attention to the app startup latency, as that’s where you’ll get the most bang for the buck. And consider doing a “minimum” of at least 1 always-running instance. See that when I sent in another 200 requests with warm containers running, things look good.

    Summary:
      Total:        1.8128 secs
      Slowest:      0.2451 secs
      Fastest:      0.0691 secs
      Average:      0.0890 secs
      Requests/sec: 110.3246
      
    
    Response time histogram:
      0.069 [1]     |
      0.087 [159]   |■■■■■■■■■■■■■■■■■■■■■■■■■■■■■■■■■■■■■■■■
      0.104 [27]    |■■■■■■■
      0.122 [3]     |■
      0.140 [0]     |
      0.157 [0]     |
      0.175 [0]     |
      0.192 [0]     |
      0.210 [0]     |
      0.227 [0]     |
      0.245 [10]    |■■■
    
    
    Latency distribution:
      10% in 0.0745 secs
      25% in 0.0767 secs
      50% in 0.0802 secs
      75% in 0.0852 secs
      90% in 0.0894 secs
      95% in 0.2365 secs
      99% in 0.2450 secs

    JavaScript (Node.js)

    Finally, let’s look at JavaScript. This is what I first learned to really program in back in 1998-ish and then in my first job out of college. It continues to be everywhere, and widely supported in public clouds. For this Node.js REST API, I chose to use the Express framework. I built a simple router that returns a couple of “employee” records as JSON.

    var express = require('express');
    var router = express.Router();
    
    /* GET employees */
    router.get('/', function(req, res, next) {
      res.json(
        [{
            id: "400",
            fullname: "Beverly Goldberg",
            location: "JKN",
            jobtitle: "Mom"
        },
        {
            id: "401",
            fullname: "Dave Kim",
            location: "JKN",
            jobtitle: "Student"
        }]
      );
    });
    
    module.exports = router;
    

    My app.js file calls out the routes and hooks it up to the /employees endpoint.

    var express = require('express');
    var path = require('path');
    var cookieParser = require('cookie-parser');
    var logger = require('morgan');
    
    var indexRouter = require('./routes/index');
    var employeesRouter = require('./routes/employees');
    
    var app = express();
    
    app.use(logger('dev'));
    app.use(express.json());
    app.use(express.urlencoded({ extended: false }));
    app.use(cookieParser());
    app.use(express.static(path.join(__dirname, 'public')));
    
    app.use('/', indexRouter);
    app.use('/employees', employeesRouter);
    
    module.exports = app;
    

    At this point, you know what it looks like to build a container image. But, don’t take it for granted. Enjoy how easy it is to do this even if you know nothing about Docker.

    gcloud builds submit --pack image=gcr.io/seroter-project-base/node-restapi 
    

    Our resulting image is a trim 82 MB in size. Nice!

    For my Node.js app, I chose the default options for Cloud Run, but shrunk the memory demands to only 256 MiB. Should be plenty. The service deployed in a few seconds. Let’s flood it with requests!

    hey -n 200 -c 10 https://node-restapi-ofanvtevaa-uc.a.run.app/employees
    

    How did our cold Node.js app do? Well! All requests were processed in about 6 seconds, and the vast majority returned a response in around 0.3 seconds.

    Summary:
      Total:        6.0293 secs
      Slowest:      2.8199 secs
      Fastest:      0.0650 secs
      Average:      0.2309 secs
      Requests/sec: 33.1711
      
      Total data:   30200 bytes
      Size/request: 151 bytes
    
    Response time histogram:
      0.065 [1]     |
      0.340 [186]   |■■■■■■■■■■■■■■■■■■■■■■■■■■■■■■■■■■■■■■■■
      0.616 [0]     |
      0.891 [0]     |
      1.167 [0]     |
      1.442 [1]     |
      1.718 [1]     |
      1.993 [1]     |
      2.269 [0]     |
      2.544 [4]     |■
      2.820 [6]     |■
    
    
    Latency distribution:
      10% in 0.0737 secs
      25% in 0.0765 secs
      50% in 0.0805 secs
      75% in 0.0855 secs
      90% in 0.0974 secs
      95% in 2.4700 secs
      99% in 2.8070 secs

    A peek at the default Cloud Run metrics show that we ended up with 10 containers handling traffic, some CPU and memory spikes, a low request latency.

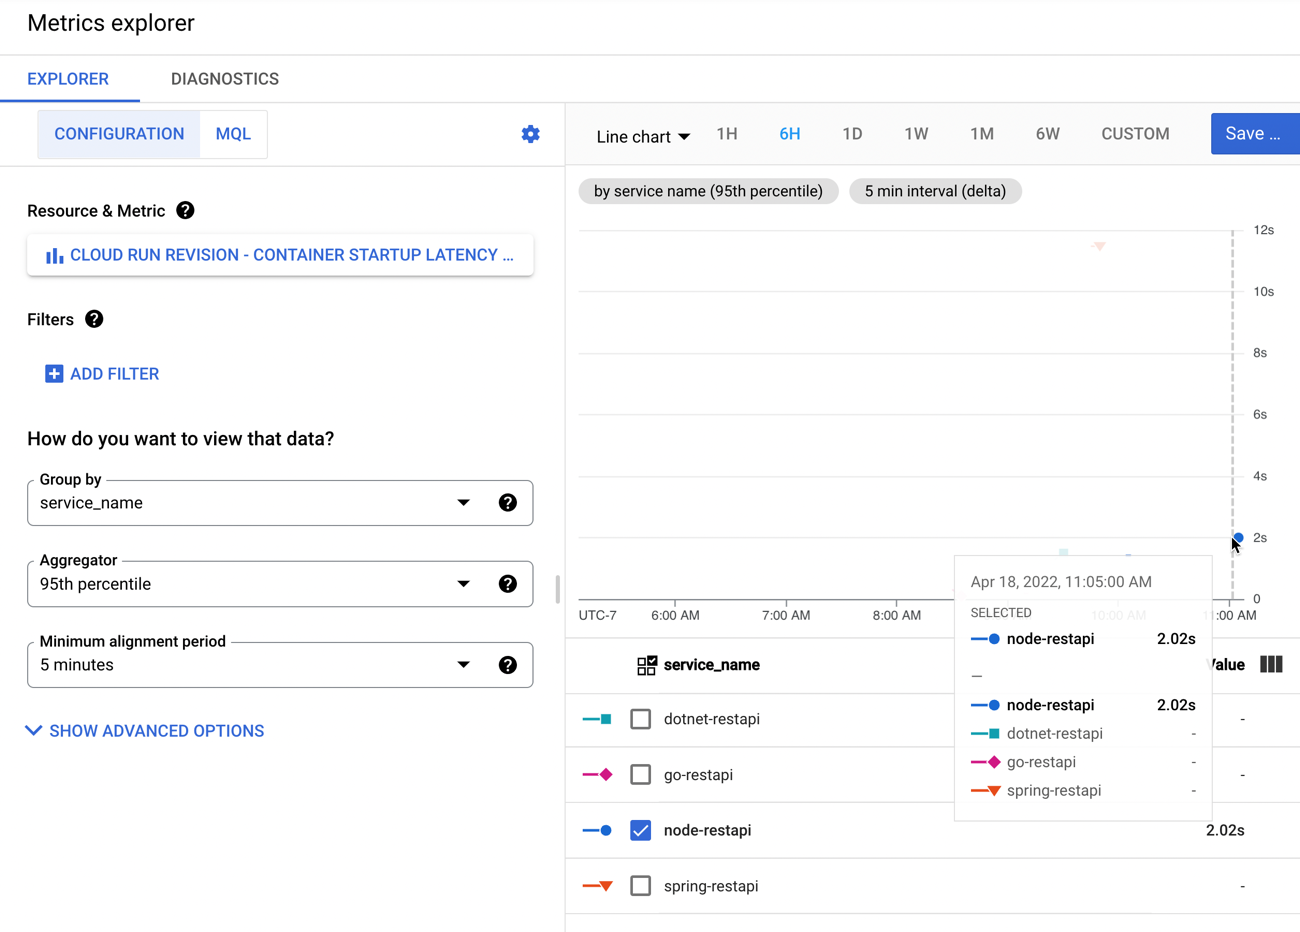
    The specific metrics around container startup latency shows a very quick initial startup time of 2.02s.

    A final load against our Node.js app shows some screaming performance against the warm containers.

    Summary:
      Total:        1.8458 secs
      Slowest:      0.1794 secs
      Fastest:      0.0669 secs
      Average:      0.0901 secs
      Requests/sec: 108.3553
      
      Total data:   30200 bytes
      Size/request: 151 bytes
    
    Response time histogram:
      0.067 [1]     |
      0.078 [29]    |■■■■■■■■■■
      0.089 [114]   |■■■■■■■■■■■■■■■■■■■■■■■■■■■■■■■■■■■■■■■■
      0.101 [34]    |■■■■■■■■■■■■
      0.112 [6]     |■■
      0.123 [6]     |■■
      0.134 [0]     |
      0.146 [0]     |
      0.157 [0]     |
      0.168 [7]     |■■
      0.179 [3]     |■
    
    
    Latency distribution:
      10% in 0.0761 secs
      25% in 0.0807 secs
      50% in 0.0860 secs
      75% in 0.0906 secs
      90% in 0.1024 secs
      95% in 0.1608 secs
      99% in 0.1765 secs

    Wrap up

    I’m not a performance engineer by any stretch, but doing this sort of testing with out-of-the-box settings seemed educational. My final container startup latency numbers at the 95th percentile were:

    There are many ways to change these numbers. If you have a more complex app with more dependencies, it’ll likely be a bigger container image and possibly a slower startup. If you tune the app to do lazy loading or ruthlessly strip out unnecessary activation steps, your startup latency goes down. It still feels safe to say that if performance is a top concern, look at Go. C# and JavaScript apps are going to be terrific here as well. Be more cautious with Java if you’re truly scaling to zero, as you may not love the startup times.

    The point of this exercise was to explore how apps written in each language get packaged and started up in a serverless compute environment. Something I missed or got wrong? Let me know in the comments!

  • Let’s compare the CLI experiences offered by AWS, Microsoft Azure, and Google Cloud Platform

    Let’s compare the CLI experiences offered by AWS, Microsoft Azure, and Google Cloud Platform

    Real developers use the CLI, or so I’m told. That probably explains why I mostly use the portal experiences of the major cloud providers. But judging from the portal experiences offered by most clouds, they prefer you use the CLI too. So let’s look at the CLIs.

    Specifically, I evaluated the cloud CLIs with an eye on five different areas:

    1. API surface and patterns. How much of the cloud was exposed via CLI, and is there a consistent way to interact with each service?
    2. Authentication. How do users identify themselves to the CLI, and can you maintain different user profiles?
    3. Creating and viewing services. What does it feel like to provision instances, and then browse those provisioned instances?
    4. CLI sweeteners. Are there things the CLI offers to make using it more delightful?
    5. Utilities. Does the CLI offer additional tooling that helps developers build or test their software?

    Let’s dig in.

    Disclaimer: I work for Google Cloud, so obviously I’ll have some biases. That said, I’ve used AWS for over a decade, was an Azure MVP for years, and can be mostly fair when comparing products and services. Please call out any mistakes I make!

    AWS

    You have a few ways to install the AWS CLI. You can use a Docker image, or install directly on your machine. If you’re installing directly, you can download from AWS, or use your favorite package manager. AWS warns you that third party repos may not be up to date. I went ahead and installed the CLI on my Mac using Homebrew.

    API surface and patterns

    As you’d expect, the AWS CLI has wide coverage. Really wide. I think there’s an API in there to retrieve the name of Andy Jassy’s favorite jungle cat. The EC2 commands alone could fill a book. The documentation is comprehensive, with detailed summaries of parameters, and example invocations.

    The command patterns are relatively consistent, with some disparities between older services and newer ones. Most service commands look like:

    aws [service name] [action] [parameters]

    Most “actions” start with create, delete, describe, get, list, or update.

    For example:

    aws elasticache create-cache-cluster --engine redis
    aws kinesis describe-stream --stream-name seroter-stream
    aws kinesis describe-stream --stream-name seroter-stream
    aws qldb delete-ledger --name seroterledger
    aws sqs list-queues

    S3 is one of the original AWS services, and its API is different. It uses commands like cp, ls, and rm. Some services have modify commands, others use update. For the most part, it’s intuitive, but I’d imagine most people can’t guess the commands.

    Authentication

    There isn’t one way to authenticate to the AWS CLI. You might use SSO, an external file, or inline access key and ID, like I do below.

    The CLI supports “profiles” which seems important when you may have different access to default values based on what you’re working on.

    Creating and viewing service instances

    By default, everything the CLI does occurs in the region of the active profile. You can override the default region by passing in a region flag to each command. See below that I created a new SQS queue without providing a region, and it dropped it into my default one (us-west-2). By explicitly passing in a target region, I created the second queue elsewhere.

    The AWS Console shows you resources for a selected region. I don’t see obvious ways to get an all-up view. A few services, like S3, aren’t bound by region, and you see all resources at once. The CLI behaves the same. I can’t view all my SQS queues, or databases, or whatever, from around the world. I can “list” the items, region by region. Deletion behaves the same. I can’t delete the above SQS queue without providing a region flag, even though the URL is region-specific.

    Overall, it’s fast and straightforward to provision, update, and list AWS services using the CLI. Just keep the region-by-region perspective in mind!

    CLI sweeteners

    The AWS CLI gives you control over the output format. I set the default for my profile to json, but you can also do yaml, text, and table. You can toggle this on a request by request basis.

    You can also take advantage of command completion. This is handy, given how tricky it may be to guess the exact syntax of a command. Similarly, I really like you can be prompted for parameters. Instead of guessing, or creating giant strings, you can go parameter by parameter in a guided manner.

    The AWS CLI also offers select opportunities to interact with the resources themselves. I can send and receive SQS messages. Or put an item directly into a DynamoDB table. There are a handful of services that let you create/update/delete data in the resource, but many are focused solely on the lifecycle of the resource itself.

    Finally, I don’t see a way to self-update from within the CLI itself. It looks like you rely on your package manager or re-download to refresh it. If I’m wrong, tell me!

    Utilities

    It doesn’t look like the CLI ships with other tools that developers might use to build apps for AWS.

    Microsoft Azure

    The Microsoft Azure CLI also has broad coverage and is well documented. There’s no shortage of examples, and it clearly explains how to use each command.

    Like AWS, Microsoft offers their CLI in a Docker image. They also offer direct downloads, or access via a package manager. I grabbed mine from Homebrew.

    API surface and patterns

    The CLI supports almost every major Azure service. Some, like Logic Apps or Blockchain, only show up in their experimental sandbox.

    Commands follow a particular syntax:

    az [service name] [object] create | list | delete | update [parameters]

    Let’s look at a few examples:

    az ad app create --display-name my-ad-app
    az cosmosdb list --resource-group group1
    az postgres db show --name mydb --resource-group group1 --server-name myserver
    az service bus queue delete --name myqueue --namespace-name mynamespace --resource-group group1

    I haven’t observed much inconsistency in the CLI commands. They all seem to follow the same basic patterns.

    Authentication

    Logging into the CLI is easy. You can simply do az login as I did below—this opens a browser window and has you sign into your Azure account to retrieve a token—or you can pass in credentials. Those credentials may be a username/password, service principal with a secret, or service principal with a client certificate.

    Once you log in, you see all your Azure subscriptions. You can parse the JSON to see which one is active, and will be used as the default. If you wish to change the default, you can use az account set --subscription [name] to pick a different one.

    There doesn’t appear to be a way to create different local profiles.

    Creating and viewing service instances

    It seems that most everything you create in Azure goes into a resource group. While a resource group has a “location” property, that’s related to the metadata, not a restriction on what gets deployed into it. You can set a default resource group (az configure --defaults group=[name]) or provide the relevant input parameter on each request.

    Unlike other clouds, Azure has a lot of nesting. You have a root account, then a subscription, and then a resource group. And most resources also have parent-child relationships you must define before you can actually build the thing you want.

    For example, if you want a service bus queue, you first create a namespace. You can’t create both at the same time. It’s two calls. Want a storage blob to upload videos into? Create a storage account first. A web application to run your .NET app? Provision a plan. Serverless function? Create a plan. This doesn’t apply to everything, but just be aware that there are often multiple steps involved.

    The creation activity itself is fairly simple. Here are commands to create Service Bus namespace and then a queue

    az servicebus namespace create --resource-group mydemos --name seroter-demos --location westus
    az servicebus queue create --resource-group mydemos --namespace-name seroter-demos --name myqueue

    Like with AWS, some Azure assets get grouped by region. With Service Bus, namespaces are associated to a geo. I don’t see a way to query all queues, regardless of region. But for the many that aren’t, you get a view of all resources across the globe. After I created a couple Redis caches in my resource group, a simple az redis list --resource-group mydemos showed me caches in two different parts of the US.

    Depending on how you use resource groups—maybe per app or per project, or even by team—just be aware that the CLI doesn’t retrieve results across resource groups. I’m not sure the best strategy for viewing subscription-wide resources other than the Azure Portal.

    CLI sweeteners

    The Azure CLI has some handy things to make it easier to use.

    There’s a find function for figuring out commands. There’s output formatting to json, tables, or yaml. You’ll also find a useful interactive mode to get auto-completion, command examples, and more. Finally, I like that the Azure CLI supports self-upgrade. Why leave the CLI if you don’t have to?

    Utilities

    I noticed a few things in this CLI that help developers. First, there’s an az rest command that lets you call Azure service endpoints with authentication headers taken care of for you. That’s a useful tool for calling secured endpoints.

    Azure offers a wide array of extensions to the CLI. These aren’t shipped as part of the CLI itself, but you can easily bolt them on. And you can create your own. This is a fluid list, but az extension list-available shows you what’s in the pool right now. As of this writing, there are extensions for preview AKS capabilities, managing Azure DevOps, working with DataBricks, using Azure LogicApps, querying the Azure Resource Graph, and more.

    Google Cloud Platform

    I’ve only recently started seriously using the GCP CLI. What’s struck me most about the gcloud tool is that it feels more like a system—dare I say, platform—than just a CLI. We’ll talk more about that in a bit.

    Like with other clouds, you can use the SDK/CLI within a supported Docker image, package manager, or direct download. I did a direct download, since this is also a self-updating CLI, so I didn’t want to create a zombie scenario with my package manager.

    API surface and patterns

    The gcloud CLI has great coverage for the full breadth of GCP. I can’t see any missing services, including things launched two weeks ago. There is a subset of services/commands available in the alpha or beta channels, and are fully integrated into the experience. Each command is well documented, with descriptions of parameters, and example calls.

    CLI commands follow a consistent pattern:

    gcloud [service] create | delete | describe | list | update [parameters]

    Let’s see some examples:

    gcloud bigtable instances create seroterdb --display-name=seroterdb --cluster=serotercluster --cluster-zone=us-east1-a
    gcloud pubsub topics describe serotertopic
    gcloud run services update --memory=1Gi
    gcloud spanner instances delete myspanner

    All the GCP services I’ve come across follow the same patterns. It’s also logical enough that I even guessed a few without looking anything up.

    Authentication

    A gcloud auth login command triggers a web-based authorization flow.

    Once I’m authenticated, I set up a profile. It’s possible to start with this process, and it triggers the authorization flow. Invoking the gcloud init command lets me create a new profile/configuration, or update an existing one. A profile includes things like which account you’re using, the “project” (top level wrapper beneath an account) you’re using, and a default region to work in. It’s a guided processes in the CLI, which is nice.

    And it’s a small thing, but I like that when it asks me for a default region, it actually SHOWS ME ALL THE REGION CODES. For the other clouds, I end up jumping back to their portals or docs to see the available values.

    Creating and viewing service instances

    As mentioned above, everything in GCP goes into Projects. There’s no regional affinity to projects. They’re used for billing purposes and managing permissions. This is also the scope for most CLI commands.

    Provisioning resources is straightforward. There isn’t the nesting you find in Azure, so you can get to the point a little faster. For instance, provisioning a new PubSub topic looks like this:

    gcloud pubsub topics create richard-topic

    It’s quick and painless. PubSub doesn’t have regional homing—it’s a global service, like others in GCP—so let’s see what happens if I create something more geo-aware. I created two Spanner instances, each in different regions.

    gcloud spanner instances create seroter-db1 --config=regional-us-east1 --description=ordersdb --nodes=1
    gcloud spanner instances create seroter-db2 --config=regional-us-west1 --description=productsdb --nodes=1

    It takes seconds to provision, and then querying with gcloud spanner instances list gives me all Spanner database instances, regardless of region. And I can use a handy “filter” parameter on any command to winnow down the results.

    The default CLI commands don’t pull resources from across projects, but there is a new command that does enable searching across projects and organizations (if you have permission). Also note that Cloud Storage (gsutil) and Big Query (bq) use separate CLIs that aren’t part of gcloud directly.

    CLI sweeteners

    I used one of the “sweeteners” before: filter. It uses a simple expression language to return a subset of results. You’ll find other useful flags for sorting and limiting results. Like with other cloud CLIs, gcloud lets you return results as json, table, csv, yaml, and other formats.

    There’s also a full interactive shell with suggestions, auto-completion, and more. That’s useful as you’re learning the CLI.

    gcloud has a lot of commands for interacting with the services themselves. You can publish to a PubSub topic, execute a SQL statement against a Spanner database, or deploy and call a serverless Function. It doesn’t apply everywhere, but I like that it’s there for many services.

    The GCP CLI also self-updates. We’ll talk about it more in the section below.

    Utilities

    A few paragraphs ago, I said that the gcloud CLI felt more like a system. I say that, because it brings a lot of components with it. When I type in gcloud components list, I see all the options:

    We’ve got the core SDK and other GCP CLIs for Big Query, but also a potpourri of other handy tools. You’ve got Kubernetes development tools like minikube, Skaffold, Kind, kpt, and kubectl. And you get a stash of local emulators for cloud services like Bigtable, Firestore, Spanner, PubSub and Spanner.

    I can install any or all of these, and upgrade them all from here. A gcloud components update command update all of them, and, shows me a nice change log.

    There are other smaller utility functions included in gcloud. I like that I have commands to configure Docker to work with Google Container Registry, Or fetch Kubernetes cluster credentials and put them into my active profile. And print my identity token to inject into the auth headers of calls to secure endpoints.

    Wrap

    To some extent, each CLI reflects the ethos of their cloud. The AWS CLI is dense, powerful, and occasionally inconsistent. The Azure CLI is rich, easy to get started with, and 15% more complicated than it should be. And the Google Cloud CLI is clean, integrated, and evolving. All of these are great. You should use them and explore their mystery and wonder.

  • Google Cloud’s support for Java is more comprehensive than I thought

    Google Cloud’s support for Java is more comprehensive than I thought

    Earlier this year, I took a look at how Microsoft Azure supports  Java/Spring developers. With my change in circumstances, I figured it was a good time to dig deep into Google Cloud’s offerings for Java developers. What I found was a very impressive array of tools, services, and integrations. More than I thought I’d find, honestly. Let’s take a tour.

    Local developer environment

    What stuff goes on your machine to make it easier to build Java apps that end up on Google Cloud?

    Cloud Code extension for IntelliJ

    Cloud Code is a good place to start. Among other things, it delivers extensions to IntelliJ and Visual Studio Code. For IntelliJ IDEA users, you get starter templates for new projects, snippets for authoring relevant YAML files, tool windows for various Google Cloud services, app deployment commands, and more. Given that 72% of Java developers use IntelliJ IDEA, this extension helps many folks.

    Cloud Code in VS Code

    The Visual Studio Code extension is pretty great too. It’s got project starters and other command palette integrations, Activity Bar entries to manage Google Cloud services, deployment tools, and more. 4% of Java devs use Visual Studio Code, so, we’re looking out for you too. If you use Eclipse, take a look at the Cloud Tools for Eclipse.

    The other major thing you want locally is the Cloud SDK. Within this little gem you get client libraries for your favorite language, CLIs, and emulators. This means that as Java developers, we get a Java client library, command line tools for all-up Google Cloud (gcloud), Big Query (bq) and Storage (gsutil), and then local emulators for cloud services like Pub/Sub, Spanner, Firestore, and more. Powerful stuff.

    App development

    Our machine is set up. Now we need to do real work. As you’d expect, you can use all, some, or none of these things to build your Java apps. It’s an open model.

    Java devs have lots of APIs to work with in the Google Cloud Java client libraries, whether talking to databases or consuming world-class AI/ML services. If you’re using Spring Boot—and the JetBrains survey reveals that the majority of you are—then you’ll be happy to discover Spring Cloud GCP. This set of packages makes it super straightforward to interact with terrific managed services in Google Cloud. Use Spring Data with cloud databases (including Cloud Spanner and Cloud Firestore), Spring Cloud Stream with Cloud Pub/Sub, Spring Caching with Cloud Memorystore, Spring Security with Cloud IAP, Micrometer with Cloud Monitoring, and Spring Cloud Sleuth with Cloud Trace.  And you get the auto-configuration, dependency injection, and extensibility points that make Spring Boot fun to use. Google offers Spring Boot starterssamples, and more to get you going quickly. And it works great with Kotlin apps too.

    Emulators available via gcloud

    As you’re building Java apps, you might directly use the many managed services in Google Cloud Platform, or, work with the emulators mentioned above. It might make sense to work with local emulators for things like Cloud Pub/Sub or Cloud Spanner. Conversely, you may decide to spin up “real” instance of cloud services to build apps using Managed Service for Microsoft Active DirectorySecret Manager, or Cloud Data Fusion. I’m glad Java developers have so many options.

    Where are you going to store your Java source code? One choice is Cloud Source Repositories. This service offers highly available, private Git repos—use it directly or mirror source code code from GitHub or Bitbucket—with a nice source browser and first-party integration with many Google Cloud compute runtimes.

    Building and packaging code

    After you’ve written some Java code, you probably want to build the project, package it up, and prepare it for deployment.

    Artifact Registry

    Store your Java packages in Artifact Registry. Create private, secure artifact storage that supports Maven and Gradle, as well as Docker and npm. It’s the eventual replacement of Container Registry, which itself is a nice Docker registry (and more).

    Looking to build container images for your Java app? You can write your own Dockerfiles. Or, skip docker build|push by using our open source Jib as a Maven or Gradle plugin that builds Docker images. Jib separates the Java app into multiple layers, making rebuilds fast. A new project is Google Cloud Buildpacks which uses the CNCF spec to package and containerize Java 8|11 apps.

    Odds are, your build and containerization stages don’t happen in isolation; they happen as part of a build pipeline. Cloud Build is the highly-rated managed CI/CD service that uses declarative pipeline definitions. You can run builds locally with the open source local builder, or in the cloud service. Pull source from Cloud Source Repositories, GitHub and other spots. Use Buildpacks or Jib in the pipeline. Publish to artifact registries and push code to compute environments. 

    Application runtimes

    As you’d expect, Google Cloud Platform offers a variety of compute environments to run your Java apps. Choose among:

    • Compute Engine. Pick among a variety of machine types, and Windows or Linux OSes. Customize the vCPU and memory allocations, opt into auto-patching of the OS, and attach GPUs.
    • Bare Metal. Choose a physical machine to host your Java app. Choose from machine sizes with as few as 16 CPU cores, and as many as 112.
    • Google Kubernetes Engine. The first, and still the best, managed Kubernetes service. Get fully managed clusters that are auto scaled, auto patched, and auto repaired. Run stateless or stateful Java apps.
    • App Engine. One of the original PaaS offerings, App Engine lets you just deploy your Java code without worrying about any infrastructure management.
    • Cloud Functions. Run Java code in this function-as-a-service environment.
    • Cloud Run. Based on the open source Knative project, Cloud Run is a managed platform for scale-to-zero containers. You can run any web app that fits into a container, including Java apps. 
    • Google Cloud VMware Engine. If you’re hosting apps in vSphere today and want to lift-and-shift your app over, you can use a fully managed VMware environment in GCP.

    Running in production

    Regardless of the compute host you choose, you want management tools that make your Java apps better, and help you solve problems quickly. 

    You might stick an Apigee API gateway in front of your Java app to secure or monetize it. If you’re running Java apps in multiple clouds, you might choose Google Cloud Anthos for consistency purposes. Java apps running on GKE in Anthos automatically get observability, transport security, traffic management, and SLO definition with Anthos Service Mesh.

    Anthos Service Mesh

    But let’s talk about day-to-day operations of Java apps. Send Java app logs to Cloud Logging and dig into them. Analyze application health and handle alerts with Cloud Monitoring. Do production profiling of your Java apps using Cloud Profiler. Hunt for performance problems via distributed tracing with Cloud Trace. And if you need to, debug in production by analyzing the running Java code (in your IDE!) with Cloud Debugger.

    Modernizing existing apps

    You probably have lots of existing Java apps. Some are fairly new, others were written a decade ago. Google Cloud offers tooling to migrate many types of existing VM-based apps to container or cloud VM environments. There’s good reasons to do it, and Java apps see real benefits.

    Migrate for Anthos takes an existing Linux or Windows VM and creates artifacts (Dockerfiles, Kubernetes YAML, etc) to run that workload in GKE. Migrate for Compute Engine moves your Java-hosting VMs into Google Compute Engine.

    All-in-all, there’s a lot to like here if you’re a Java developer. You can mix-and-match these Google Cloud services and tools to build, deploy, run, and manage Java apps.

  • Take a fresh look at Cloud Foundry? In 20 minutes we’ll get Tanzu Application Service for Kubernetes running on your machine.

    Take a fresh look at Cloud Foundry? In 20 minutes we’ll get Tanzu Application Service for Kubernetes running on your machine.

    It’s been nine years since I first tried out Cloud Foundry, and it remains my favorite app platform. It runs all kinds of apps, has a nice dev UX for deploying and managing software, and doesn’t force me to muck with infrastructure. The VMware team keeps shipping releases (another today) of the most popular packaging of Cloud Foundry, Tanzu Application Service (TAS). One knock against Cloud Foundry has been its weight—in typically runs on dozens of VMs. Others have commented on its use of open-source, but not widely-used, components like BOSH, the Diego scheduler, and more. I think there are good justifications for its size and choice of plumbing components, but I’m not here to debate that. Rather, I want to look at what’s next. The new Tanzu Application Service (TAS) for Kubernetes (now in beta) eliminates those prior concerns with Cloud Foundry, and just maybe, leapfrogs other platforms by delivering the dev UX you like, with the underlying components—things like Kubernetes, Cluster API, Istio, Envoy, fluentd, and kpack—you want. Let me show you.

    TAS runs on any Kubernetes cluster: on-premises or in the cloud, VM-based or a managed service, VMware-provided or delivered by others. It’s based on the OSS Cloud Foundry for Kubernetes project, and available for beta download with a free (no strings attached) Tanzu Network account. You can follow along with me in this post, and in just a few minutes, have a fully working app platform that accepts containers or source code and wires it all up for you.

    Step 1 – Download and Start Stuff (5 minutes)

    Let’s get started. Some of these initial steps will go away post-beta as the install process gets polished up. But we’re brave explorers, and like trying things in their gritty, early stages, right?

    First, we need a Kubernetes. That’s the first big change for Cloud Foundry and TAS. Instead of pointing it at any empty IaaS and using BOSH to create VMs, Cloud Foundry now supports bring-your-own-Kubernetes. I’m going to use Minikube for this example. You can use KinD, or any other number of options.

    Install kubectl (to interact with the Kubernetes cluster), and then install Minikube. Ensure you have a recent version of Minikube, as we’re using the Docker driver for better performance. With Minikube installed, execute the following command to build out our single-node cluster. TAS for Kubernetes is happiest running on a generously-sized cluster.

    minikube start --cpus=4 --memory=8g --kubernetes-version=1.15.7 --driver=docker

    After a minute or two, you’ll have a hungry Kubernetes cluster running, just waiting for workloads.

    We also need a few command line tools to get TAS installed. These tools, all open source, do things like YAML templating, image building, and deploying things like Cloud Foundry as an “app” to Kubernetes. Install the lightweight kapp, klbd, and ytt tools using these simple instructions.

    You also need the Cloud Foundry command line tool. This is for interacting with the environment, deploying apps, etc. This same CLI works against a VM-based Cloud Foundry, or Kubernetes-based one. You can download the latest version via your favorite package manager or directly.

    Finally, you’ll want to install the BOSH CLI. Wait a second, you say, didn’t you say BOSH wasn’t part of this? Am I just a filthy liar? First off, no name calling, you bastards. Secondly, no, you don’t need to use BOSH, but the CLI itself helps generate some configuration values we’ll use in a moment. You can download the BOSH CLI via your favorite package manager, or grab it from the Tanzu Network. Install via the instructions here.

    With that, we’re done the environmental setup.

    Step 2 – Generate Stuff (2 minute)

    This is quick and easy. Download the 844KB TAS for Kubernetes bundle from the Tanzu Network.

    I downloaded the archive to my desktop, unpacked it, and renamed the folder “tanzu-application-service.” Create a sibling folder named “configuration-values.”

    Now we’re going to create the configuration file. Run the following command in your console, which should be pointed at the tanzu-application-service directory. The first quoted value is the domain. For my local instance, this value is vcap.me. When running this in a “real” environment, this value is the DNS name associated with your cluster and ingress point. The output of this command is a new file in the configuration-values folder.

    ./bin/generate-values.sh -d "vcap.me" > ../configuration-values/deployment-values.yml

    After a couple of seconds, we have an impressive-looking YAML file with passwords, certificates, and all sorts of delightful things.

    We’re nearly done. Our TAS environment won’t just run containers; it will also use kpack and Cloud Native Buildpacks to generate secure container images from source code. That means we need a registry for stashing generated images. You can use most any one you want. I’m going to use Docker Hub. Thus, the final configuration values we need are appended to the above file. First, we need the credentials to the Tanzu Network for retrieving platform images, and secondly, credentials for container registry.

    With our credentials in hand, add them to the very bottom of the file. Indentation matters, this is YAML after all, so ensure you’ve got it lined up right.

    The last thing? There’s a file that instructs the installation to create a cluster IP ingress point versus a Kubernetes load balancer resource. For Minikube (and in public cloud Kubernetes-as-a-Service environments) I want the load balancer. So, within the tanzu-application-service folder, move the replace-loadbalancer-with-clusterip.yaml file from the custom-overlays folder to the config-optional folder.

    Finally, to be safe, I created a copy of this remove-resource-requirements.yml file and put it in the custom-overlays folder. It relaxes some of the resource expectations for the cluster. You may not need it, but I saw CPU exhaustion issues pop up when I didn’t use it.

    All finished. Let’s deploy this rascal.

    Step 3 – Deploy Stuff (10 minutes)

    Deploying TAS to Kubernetes takes 5-9 minutes. With your console pointed at the tanzu-application-service directory, run this command:

    ./bin/install-tas.sh ../configuration-values

    There’s a live read-out of progress, and you can also keep checking the Kubernetes environment to see the pods inflate. Tools like k9s make it easy to keep an eye on what’s happening. Notice the Istio components, and some familiar Cloud Foundry pieces. Observe that the entire Cloud Foundry control plane is containerized here—no VMs anywhere to be seen.

    While this is still installing, let’s open up the Minikube tunnel to expose the LoadBalancer service our ingress gateway needs. Do this in a separate console window, as its a blocking call. Note that the installation can’t complete until you do it!

    minikube tunnel

    After a few minutes, we’re ready to deploy workloads.

    Step 4 – Test Stuff (3 minutes)

    We now have a full-featured Tanzu Application Service up and running. Neat. Let’s try a few things. First, we need to point the Cloud Foundry CLI at our environment.

    cf api --skip-ssl-validation https://api.vcap.me

    Great. Next, we log in, using generated cf_admin_password from the deployment-values.yaml file.

    cf auth admin <password>

    After that, we’ll enable containers in the environment.

    cf enable-feature-flag diego_docker

    Finally, we set up a tenant. Cloud Foundry natively supports isolation between tenants. Here, I set up an organization, and within that organization, a “space.” Finally, I tell the Cloud Foundry CLI that we’re working with apps in that particular org and space.

    cf create-org seroter-org
    cf create-space -o seroter-org dev-space
    cf target -o seroter-org -s dev-space

    Let’s do something easy, first. Push a previously-containerized app. Here’s one from my Docker Hub, but it can be anything you want.

    cf push demo-app -o rseroter/simple-k8s-app-kpack

    After you enter that command, 15 seconds later you have a hosted, routable app. The URL is presented in the Cloud Foundry CLI.

    How about something more interesting? TAS for Kubernetes supports a variety of buildpacks. These buildpacks detect the language of your app, and then assemble a container image for you. Right now, the platform builds Java, .NET Core, Go, and Node.js apps. To make life simple, clone this sample Node app to your machine. Navigate your console to that folder, and simple enter cf push.

    After a minute or so, you end up with a container image in whatever registry you specified (for me, Docker Hub), and a running app.

    This beta release of TAS for Kubernetes also supports commands around log streaming (e.g. cf logs cf-nodejs), connecting to backing services like databases, and more. And yes, even the simple, yet powerful, cf scale command works to expand and contract pod instances.

    It’s simple to uninstall the entire TAS environment from your Kubernetes cluster with a single command:

    kapp delete -a cf

    Thanks for trying this out with me! If you only read along, and want to try it yourself later, read the docs, download the bits, and let me know how it goes.

  • I’ve noticed three types of serverless compute platforms. Let’s deploy something to each.

    I’ve noticed three types of serverless compute platforms. Let’s deploy something to each.

    Are all serverless compute platforms—typically labeled Function-as-a-Service—the same? Sort of. They all offer scale-to-zero compute triggered by events and billed based on consumed resources. But I haven’t appreciated the nuances of these offerings, until now. Last week, Laurence Hecht did great work analyzing the latest CNCF survey data. It revealed which serverless (compute) offerings have the most usage. To be clear, this is about compute, not databases, API gateways, workflow services, queueing, or any other managed services.

    To me, the software in that list falls into one of three categories: connective compute, platform expanding, and full stack apps. Depending on what you want to accomplish, one may be better than the others. Let’s look at those three categories, see which platforms fall into each one, and see an example in action.

    Category 1: Connective Compute

    Trigger / DestinationSignaturePackagingDeployment
    Database, storage, message queue, API Gateway, CDN, Monitoring service Handlers with specific parametersZIP archive, containersWeb portal, CLI, CI/CD pipelines

    The best functions are small functions that fill the gaps between managed services. This category is filled with products like AWS Lambda, Microsoft Azure Functions, Google Cloud Functions, Alibaba Cloud Functions, and more. These functions are triggered when something happens in another managed service—think of database table changes, messages reaching a queue, specific log messages hitting the monitoring system, and files uploaded to storage. With this category of serveless compute, you stitch together managed services into apps, writing as little code as possible. Little-to-none of your existing codebase transfers over, as this caters to greenfield solutions based on a cloud-first approach.

    AWS Lambda is the grandaddy of them all, so let’s take a look at it.

    In my example, I want to read messages from a queue. Specifically, have an AWS Lambda function read from Amazon SQS. Sounds simple enough!

    You can write AWS Lambda functions in many ways. You can also deploy them in many ways. There are many frameworks that try to simplify the latter, as you would rarely deploy a single function as your “app.” Rather, a function is part of a broader collection of resources that make up your system. Those resources might be described via the AWS Serverless Application Model (SAM), where you can lay out all the functions, databases, APIs and more that should get deployed together. And you could use the AWS Serverless Application Repository to browse and deploy SAM templates created by you, or others. However you define it, you’ll deploy your function-based system via the AWS CLI, AWS console, AWS-provided CI/CD tooling, or 3rd party tools like CircleCI.

    For this simple demo, I’m going to build a C#-based function and deploy it via the AWS console.

    First up, I went to the AWS console and defined a new queue in SQS. I chose the “standard queue” type.

    Next up, creating a new AWS Lambda function. I gave it a name, chose .NET Core 3.1 as my runtime, and created a role with basic permissions.

    After clicking “create function”, I get a overview screen that shows the “design” of my function and provides many configuration settings.

    I clicked “add trigger” to specify what event kicks off my function. I’ve got lots of options to choose from, which is the hallmark of a “connective compute” function platform. I chose SQS, selected my previously-created queue from the dropdown list, and clicked “Add.”

    Now all I have to do is the write the code that handles the queue message. I chose VS Code as my tool. At first, I tried using the AWS Toolkit for Visual Studio Code to generate a SAM-based project, but the only template was an API-based “hello world” one that forced me to retrofit a bunch of stuff after code generation. So, I decided to skip SAM for now, and code the AWS Lambda function directly, by itself.

    The .NET team at AWS has done below-the-radar great work for years now, and their Lambda tooling is no exception. They offer a handful of handy templates you can use with the .NET CLI. One basic command installs them for you: dotnet new -i Amazon.Lambda.Templates

    I chose to create a new project by entering dotnet new lambda.sqs. This produced a pair of projects, one with the function source code, and one that has unit tests. The primary project also has a aws-lambda-tools-default.json file that includes command line options for deploying your function. I’m not sure if I need it given I’m deploying via CLI, but I updated references to .NET Core 3.1 anyway. Note that the “function-handler” value *is* important, as we’ll need that shortly. This tells Lambda which operation (in which class) to invoke.

    I kept the generated function code, which simply prints out the contents of the message pulled from Amazon SQS.

    I successfully built the project, and then had to “publish” it to get the right assets for packaging. This publish command ensures that configuration files get bundled up as well:

    dotnet publish /p:GenerateRuntimeConfigurationFiles=true

    Now, all I have to do is zip up the resulting files in the “publish” directory. With those DLLs and *.json files zipped up, I return to the AWS console to upload my code. In most cases, you’re going to stash the archive file in Amazon S3 (either manually, or as the result of a CI process). Here, I uploaded my ZIP file directly, AND, set the function handler value equal to the “function-handler” value from my configuration file.

    After I click “save”, I get a notice that my function was updated. I went back to Amazon SQS, and sent a few messages to the queue, using the “send a message” option.

    After a moment, I saw entries in the “monitoring” view of the AWS Lambda console, and drilled into the CloudWatch logs and saw that my function wrote out the SQS payloads.

    I’m impressed at how far the AWS Lambda experience has come since I first tried it out. You’ll find similarly solid experiences from Microsoft, Google and others as you use their FaaS platforms as glue code to connect managed services.

    Category 2: Platform Expanding

    Trigger / DestinationSignaturePackagingDeployment
    HTTPHandlers with specific parameterscode packagesWeb portal, CLI

    There’s a category of FaaS that, to me, isn’t about connecting services together, as much as it’s about expanding or enriching the capabilities of a host platform. From the list above, I’d put offerings like Cloudflare Workers, Twilio Functions, and Zeit Serverless Functions into that bucket.

    Most, if not all, of these start with an HTTP request and only support specific programming languages. For Twilio, you can use their integrated FaaS to serve up tokens, call outbound APIs after receiving an SMS, or even change voice calls. Zeit is an impressive host for static sites, and their functions platform supports backend operations like authentication, form submissions, and more. And Cloudflare Workers is about adding cool functionality whenever someone sends a request to a Cloudfare-managed domain. Let’s actually mess around with Cloudflare Workers.

    I go to my (free) Cloudflare account to get started. You can create these running-at-the-edge functions entirely in the browser, or via the Wrangler CLI. Notice here that Workers support JavaScript, Rust, C, and C++.

    After I click “create a Worker”, I’m immediately dropped into a web console where I can author, deploy, and test my function. And, I get some sample code that represents a fully-working Worker. All workers start by responding to a “fetch” event.

    I don’t think you’d use this to create generic APIs or standalone apps. No, you’d use this to make the Cloudflare experience better. They handily have a whole catalog of templates to inspire you, or do your work for you. Most of these show examples of legit Cloudflare use cases: inspect and purge sensitive data from responses, deny requests missing an authorization header, do A/B testing based on cookies, and more. I copied the code from the “redirect” template which redirects requests to a different URL. I changed a couple things, clicked “save and deploy” and called my function.

    On the left is my code. In the middle is the testing console, where I submitted a GET request, and got back a “301 Moved Permanently” HTTP response. I also see a log entry from my code. If you call my function in your browser, you’ll get redirected to cloudflare.com.

    That was super simple. The serverless compute products in this category have a constrained set of functionality, but I think that’s on purpose. They’re meant to expand the set of problems you can solve with their platform, versus creating standalone apps or services.

    Category 3: Full Stack Apps

    Trigger / DestinationSignaturePackagingDeployment
    HTTP, queue, timeNoneContainersWeb portal, CLI, CI/CD pipelines

    This category—which I can’t quite figure out the right label for—is about serverless computing for complete web apps. These aren’t functions, per-se, but run on a serverless stack that scales to zero and is billed based on usage. The unit of deployment is a container, which means you are providing more than code to the platform—you are also supplying a web server. This can make serverless purists squeamish since a key value prop of FaaS is the outsourcing of the server to the platform, and only focusing on your code. I get that. The downside of that pure FaaS model is that it’s an unforgiving host for any existing apps.

    What fits in this category? The only obvious one to me is Google Cloud Run, but AWS Fargate kinda fits here too. Google Cloud Run is based on the popular open source Knative project, and runs as a managed service in Google Cloud. Let’s try it out.

    First, install the Google Cloud SDK to get the gcloud command line tool. Once the CLI gets installed, you do a gcloud init in order to link up your Google Cloud credentials, and set some base properties.

    Now, to build the app. What’s interesting here, is this is just an app. There’s no special format or method signature. The app just has to accept HTTP requests. You can write the app in any language, use any base image, and end up with a container of any size. The app should still follow some basic cloud-native patterns around fast startup and attached storage. This means—and Google promotes this—that you can migrate existing apps fairly easily. For my example, I’ll use Visual Studio for Mac to build a new ASP.NET Web API project with a couple RESTful endpoints.

    The default project generates a weather-related controller, so let’s stick with that. To show that Google Cloud Run handles more than one endpoint, I’m adding a second method. This one returns a forecast for Seattle, which has been wet and cold for months.

    namespace seroter_api_gcr.Controllers
    {
        [ApiController]
        [Route("[controller]")]
        public class WeatherForecastController : ControllerBase
        {
            private static readonly string[] Summaries = new[]
            {
                "Freezing", "Bracing", "Chilly", "Cool", "Mild", "Warm", "Balmy", "Hot", "Sweltering", "Scorching"
            };
    
            private readonly ILogger<WeatherForecastController> _logger;
    
            public WeatherForecastController(ILogger<WeatherForecastController> logger)
            {
                _logger = logger;
            }
    
            [HttpGet]
            public IEnumerable<WeatherForecast> Get()
            {
                var rng = new Random();
                return Enumerable.Range(1, 5).Select(index => new WeatherForecast
                {
                    Date = DateTime.Now.AddDays(index),
                    TemperatureC = rng.Next(-20, 55),
                    Summary = Summaries[rng.Next(Summaries.Length)]
                })
                .ToArray();
            }
    
            [HttpGet("seattle")]
            public WeatherForecast GetSeattleWeather()
            {
                return new WeatherForecast { Date = DateTime.Now, Summary = "Chilly", TemperatureC = 6 };
            }
        }
    }
    

    If I were doing this the right way, I’d also change my Program.cs file and read the port from a provided environment variable, as Google suggests. I’m NOT going to do that, and instead will act like I’m just shoveling an existing, unchanged API into the service.

    The app is complete and works fine when running locally. To work with Google Cloud Run, my app must be containerized. You can do this a variety of ways, including the most reasonable, which involves Google Cloud Build and continuous delivery. I don’t roll like that. WE’RE DOING IT BY HAND.

    I will cheat and have Visual Studio give me a valid Dockerfile. Right-click the project, and add Docker support. This creates a Docker Compose project, and throws a Dockerfile into my original project.

    Let’s make one small tweak. In the Dockerfile, I’m exposing port 5000 from my container, and setting an environment variable to tell my app to listen on that port.

    I opened my CLI, and navigated to the folder directly above this project. From there, I executed a Docker build command that pointed to the generated Dockerfile, and tagged the image for Google Container Registry (where Google Cloud Run looks for images).

    docker build --file ./seroter-api-gcr/Dockerfile . --tag gcr.io/seroter/seroter-api-gcr

    That finished, and I had a container image in my local registry. I need to get it up to Google Container Registry, so I ran a Docker push command.

    docker push gcr.io/seroter/seroter-api-gcr

    After a moment, I see that container in the Google Container Registry.

    Neat. All that’s left is to spin up Google Cloud Run. From the Google Cloud portal, I choose to create a new Google Cloud Run service. I choose a region and name for my service.

    Next up, I chose the container image to use, and set the container port to 5000. There are lots of other settings here too. I can create a connection to managed services like Cloud SQL, choose max requests per container, set the request timeout, specify the max number of container instances, and more.

    After creating the service, I only need to wait a few seconds before my app is reachable.

    As expected, I can ping both API endpoints and get back a result. After a short duration, the service spins compute down to zero.

    Wrap up

    The landscape of serverless computing is broader than you may think. Depending on what you’re trying to do, it’s possible to make a sub-optimal choice. If you’re working with many different managed services and writing code to connect them, use the first category. If you’re enriching existing platforms with bits of compute functionality, use the second category. And if you’re migrating or modernizing existing apps, or have workloads that demand more platform flexibility, choose the third. Comments? Violent disagreement? Tell me below.

  • Let’s try out the new durable, replicated quorum queues in RabbitMQ

    Let’s try out the new durable, replicated quorum queues in RabbitMQ

    Coordination in distributed systems is hard. How do a series of networked processes share information and stay in sync with each other? Recently, the RabbitMQ team released a new type of queue that uses the Raft Consensus Algorithm to offer a durable, first-in-first-out queuing experience in your cluster. This is a nice fit for scenarios where you can’t afford data loss, and you also want the high availability offered by a clustered environment. Since RabbitMQ is wildly popular and used all over the place, I thought it’d be fun to dig into quorum queues, and give you an example that you can follow along with.

    What do you need on your machine to follow along? Make sure you have Docker Desktop, or some way to instantiate containers from a Docker Compose file. And you should have git installed. You COULD stop there, but I’m also building a small pair of apps (publisher, subscriber) in Spring Boot. To do that part, ensure you have the JDK installed, and an IDE (Eclipse or IntelliJ) or code editor (like VS Code with Java + Boot extensions) handy. That’s it.

    Before we start, a word about quorum queues. They shipped as part of a big RabbitMQ 3.8 release in the Fall of 2019. Quorum queues are the successor to mirrored queues, and improve on them in a handful of ways. By default, queues are located on a single node in a cluster. Obviously something that sits on a single node is at risk of downtime! So, we mitigate that risk by creating clusters. Mirrored queues have a master node, and mirrors across secondary nodes in the cluster for high availability. If a master fails, one of the mirrors gets promoted and processing continues. My new colleague Jack has a great post on how quorum queues “fix” some of the synchronization and storage challenges with mirrored queues. They’re a nice improvement, which is why I wanted to explore them a bit.

    Let’s get going. First, we need to get a RabbitMQ cluster up and running. Thanks to containers, this is easy. And thanks to the RabbitMQ team, it’s super easy. Just git clone the following repo:

    git clone https://github.com/rabbitmq/rabbitmq-prometheus
    

    In that repo are Docker Compose files. The one we care about is in the docker folder and called docker-compose-qq.yml. In here, you’ll see a network defined, and some volumes and services. This setup creates a three node RabbitMQ cluster. If you run this right now (docker-compose -f docker/docker-compose-qq.yml up) you’re kind of done (but don’t stop here!). The final service outlined in the Compose file (qq-moderate-load) creates some queues for you, and generates some load, as seen below in the RabbitMQ administration console.

    You can see above that the queue I selected is a “quorum” queue, and that there’s a leader of the queue and multiple online members. If I deleted that leader node, the messaging traffic would continue uninterrupted and a new leader would get “elected.”

    I don’t want everything done for me, so after cleaning up my environment (docker-compose -f docker/docker-compose-qq.yml down), I deleted the qq-moderate-load service definition from my Docker Compose file, and renamed it. Then I spun it up again, with the new file name:

    docker-compose -f docker/docker-compose-qq-2.yml up
    

    We now have an “empty” RabbitMQ, with three nodes in the cluster, but no queues or exchanges.

    Let’s create a quorum queue. On the “Queues” tab of this administration console, fill in a name for the new queue (I called mine qq-1), select quorum as the type, and pick a node to set as the leader. I picked rmq1-qq. Click the “Add queue” button.

    Now we need an exchange, which is the publisher-facing interface. Create a fanout exchange named qq-exchange-fanout and then bind our queue to this exchange.

    Ok, that’s it for RabbitMQ. We have a highly available queue stood up with replication across three total nodes. Sweet. Now, we need an app to publish messages to the exchange.

    I went to start.spring.io to generate a Spring Boot project. You can talk to RabbitMQ from virtually any language, using any number of supported SDKs. This link gives you a Spring Boot project identical to mine.

    I included dependencies on Spring Cloud Stream and Spring for RabbitMQ. These packages inflate all the objects necessary to talk to RabbitMQ, without forcing my code to know anything about RabbitMQ itself.

    Two words to describe my code? Production Grade. Here’s all I needed to write to publish a message every 500ms.

    package com.seroter.demo;
    
    import org.springframework.boot.SpringApplication;
    import org.springframework.boot.autoconfigure.SpringBootApplication;
    import org.springframework.cloud.stream.annotation.EnableBinding;
    import org.springframework.cloud.stream.messaging.Source;
    import org.springframework.context.annotation.Bean;
    import org.springframework.integration.annotation.InboundChannelAdapter;
    import org.springframework.integration.core.MessageSource;
    import org.springframework.messaging.support.GenericMessage;
    import org.springframework.integration.annotation.Poller;
    
    @EnableBinding(Source.class)
    @SpringBootApplication
    public class RmqPublishQqApplication {
    
    	public static void main(String[] args) {
    		SpringApplication.run(RmqPublishQqApplication.class, args);
    	}
    	
    	private int counter = 0;
    	
    	@Bean
    	@InboundChannelAdapter(value = Source.OUTPUT, poller = @Poller(fixedDelay = "500", maxMessagesPerPoll = "1"))
    	public MessageSource<String> timerMessageSource() {
    		
    		return () -> {
    			counter++;
    			System.out.println("Spring Cloud Stream message number " + counter);
    			return new GenericMessage<>("Hello, number " + counter);
    		};
    	}
    }


    The @EnableBinding attribute and reference to the Source class marks this as streaming source, and I used Spring Integration’s InboundChannelAdapter to generate a message, with an incrementing integer, on a pre-defined interval.

    My configuration properties are straightforward. I list out all the cluster nodes (to enable failover if a node fails) and provide the name of the existing exchange. I could use Spring Cloud Stream to generate the exchange, but wanted to experiment with creating it ahead of time.

    spring.rabbitmq.addresses=localhost:5679,localhost:5680,localhost:5681
    
    spring.rabbitmq.username=guest
    spring.rabbitmq.password=guest
     
    spring.cloud.stream.bindings.output.destination=qq-exchange-fanout
    spring.cloud.stream.rabbit.bindings.output.producer.exchange-type=fanout
    

    Before starting up the publisher, let’s create the subscriber. Back in start.spring.io, create another app named rmq-subscribe-qq with the same dependencies as before. Click here for a link to download this project definition.

    The code for the subscriber is criminally simple. All it takes is the below code to pull a message from the queue and process it.

    package com.seroter.demo;
    
    import org.springframework.boot.SpringApplication;
    import org.springframework.boot.autoconfigure.SpringBootApplication;
    import org.springframework.cloud.stream.annotation.EnableBinding;
    import org.springframework.cloud.stream.annotation.StreamListener;
    import org.springframework.cloud.stream.messaging.Sink;
    
    @EnableBinding(Sink.class)
    @SpringBootApplication
    public class RmqSubscribeQqApplication {
    
    	public static void main(String[] args) {
    		SpringApplication.run(RmqSubscribeQqApplication.class, args);
    	}
    	
    	@StreamListener(target = Sink.INPUT)
    	public void pullMessages(String s) {
    		System.out.println("Spring Cloud Stream message received: " + s);
    	}
    }
    

    It’s also annotated with an @EnableBinding declaration and references the Sink class which gets this wired up as a message receiver. The @StreamListener annotation marks this method as the one that handles whatever gets pulled off the queue. Note that the new functional paradigm for Spring Cloud Stream negates the need for ANY streaming annotations, but I like the existing model for explaining what’s happening.

    The configuration for this project looks pretty similar to the publisher’s configuration. The only difference is that we’re setting the queue name (as “group”) and indicating that Spring Cloud Stream should NOT generate a queue, but use the existing one.

    spring.rabbitmq.addresses=localhost:5679,localhost:5680,localhost:5681
    
    spring.rabbitmq.username=guest
    spring.rabbitmq.password=guest
     
    spring.cloud.stream.bindings.input.destination=qq-exchange-fanout
    spring.cloud.stream.bindings.input.group=qq-1
    spring.cloud.stream.rabbit.bindings.input.consumer.queue-name-group-only=true
    

    We’re done! Let’s test it out. I opened up a few console windows, the first pointing to the publisher project, the second to the subscriber project, and a third that will shut down a RabbitMQ node when the time comes.

    To start up each Spring Boot project, enter the following command into each console:

    ./mvnw spring-boot:run
    

    Immediately, I see the publisher publishing, and the subscriber subscribing. The messages arrive in order from a quorum queue.

    In the RabbitMQ management console, I can see that we’re processing messages, and that rmq1-qq is the queue leader. Let’s shut down that node. From the other console (not the publisher or subscriber) switch the git folder that you downloaded at the beginning, and enter the following command to remove the RabbitMQ node from the cluster:

    docker-compose -f docker/docker-compose-qq-2.yml stop rmq1-qq

    As you can see, the node goes away, and there’s no pause in processing, and the Spring Boot app keeps happily sending and receiving data, in order.

    Back in the RabbitMQ administration console, note that there’s a new leader for the quorum queue (not rmq1-qq as we originally set up), and just two of the three cluster members are online. All of this “just happens” for you.

    For fun, I also started up the stopped node, and watched it quickly rejoin the cluster and start participating in the quorum queue again.

    A lot of your systems depend on your messaging middleware. It probably doesn’t get much praise, but everyone sure yells when it goes down! Because distributed systems are hard, keeping that infrastructure highly available with no data loss isn’t easy. I like things like RabbitMQ’s quorum queues, and you should keep playing with them. Check out the terrific documentation to go even deeper.

  • Looking to continuously test and patch container images? I’ll show you one way.

    Looking to continuously test and patch container images? I’ll show you one way.

    A lot of you are packaging code into container images before shipping it off to production. That’s cool. For many, this isn’t a one-time exercise at the end of a project; it’s an ongoing exercise throughout the lifespan of your product. Last week in Barcelona, I did a presentation at VMworld Europe where I took a custom app, ran tests in a pipeline, containerized it, and pushed to a cloud runtime. I did all of this with fresh open-source technologies like Kubernetes, Concourse, and kpack. For this blog post, I’ll show you my setup, and for fun, take the resulting container image and deploy it, unchanged, to one Microsoft Azure service, and one Pivotal service.

    First off, containers. Let’s talk about them. The image that turns into running container is made up of a series of layers. This union of read-only layers gets mounted to present itself as a single filesystem. Many commands in your Dockerfile, generate a layer. When I pull the latest Redis image, and run a docker history command, I see all the layers:

    Ok, Richard, we get it. Like onions and ogres, images have layers. I bring it up, because responsibly maintaining a container image means continually monitoring and updating those layers. For a custom app, that means updating layers that store app code, the web server, and the root file system. All the time. Ideally, I want a solution that automatically builds and patches all this stuff so that I don’t have to. Whatever pipeline to production you build should have that factored in!

    Let’s get to it. Here’s what I built. After coding a Spring Boot app, I checked the code into a GitHub master branch. That triggered a Concourse pipeline (running in Kubernetes) that ran unit tests, and promoted the code to a “stable” branch if the tests passed. The container build service (using the kpack OSS project) monitored the stable branch, and built a container image which got stored in the Docker Hub. From there, I deployed the Docker image to a container-friendly application runtime. Easy!

    Step #1 – Build the app

    The app is simple, and relatively inconsequential. Build a .NET app, Go app, Node.js app, whatever. I built a Spring Boot app using Spring Initializr. Click here to download the same scaffolding. This app will simply serve up a web endpoint, and also offer a health endpoint.

    In my code, I have a single RESTful endpoint that responds to GET requests at the root. It reads an environment variable (so that I can change it per runtime), and returns that in the response.

    @RestController
    public class GreetingController {
    	
      @Value("${appruntime:Spring Boot}")
      private String appruntime;
    	
      @GetMapping("/")
      public String SayHi() {
        return "Hello VMworld Europe! Greetings from " + appruntime;
      }
    }
    

    I also created a single JUnit test to check the response value from my RESTful service. I write great unit tests; don’t be jealous.

    @RunWith(SpringRunner.class)
    @SpringBootTest(webEnvironment = WebEnvironment.RANDOM_PORT)
    public class BootKpackDemoApplicationTests {
    
      @LocalServerPort
      private int port;
    	
      @Autowired
      private TestRestTemplate restTemplate;
    	
      @Test
      public void testEndpoint() {
        assertThat(this.restTemplate.getForObject("http://localhost:" + port + "/",
        String.class)).contains("Hello");
      }
    }
    

    After crafting this masterpiece, I committed it to a GitHub repo. Ideally, this is all a developer ever has to do in their job. Write code, test it, check it in, repeat. I don’t want to figure out the right Dockerfile format, configure infrastructure, or any other stuff. Just let me write code, and trigger a pipeline that gets my code securely to production, over and over again.

    Step #2 – Set up the CI pipeline

    For this example, I’m using minikube on my laptop to host the continuous integration software and container build service. I got my Kubernetes 1.15 cluster up (since Concourse currently works up to v 1.15) with this command:

    minikube start --memory=4096 --cpus=4 --vm-driver=hyperkit --kubernetes-version v1.15.0
    

    Since I wanted to install Concourse in Kubernetes via Helm, I needed Helm and tiller set up. I used a package manager to install Helm on my laptop. Then I ran three commands to generate a service account, bind a cluster role to that service account, and initialize Helm in the cluster.

    kubectl create serviceaccount -n kube-system tiller 
    kubectl create clusterrolebinding tiller-cluster-rule --clusterrole=cluster-admin --serviceaccount=kube-system:tiller 
    helm init --service-account tiller 
    

    With that business behind me, I could install Concourse. I talk a lot about Concourse, taught a Pluralsight course about it, and use it regularly. It’s such a powerful tool for continuous processing of code. To install into Kubernetes, it’s just a single reference to a Helm chart.

    helm install --name vmworld-concourse stable/concourse
    

    After a few moments, I saw that I had pods created and services configured.

    The chart also printed out commands for how to do port forwarding to access the Concourse web console.

    export POD_NAME=$(kubectl get pods --namespace default -l "app=vmworld-concourse-web" -o jsonpath="{.items[0].metadata.name}")
     echo "Visit http://127.0.0.1:8080 to use Concourse"
     kubectl port-forward --namespace default $POD_NAME 8080:8080
    

    After running those commands, I pinged the localhost URL and saw the dashboard.

    All that was left was the actual pipeline. Concourse pipelines are defined in YAML. My GitHub repo has two branches (master and stable), so I declared “resources” for both. Since I have to write to the stable branch, I also included credentials to GitHub in the “stable” resource definition. My pipeline has two jobs: one that runs the JUnit tests, and another puts the master branch code into the stable branch if the unit tests pass.

    ---
    # declare resources
    resources:
    - name: source-master
      type: git
      icon: github-circle
      source:
        uri: https://github.com/rseroter/boot-kpack-demo
        branch: master
    - name: source-stable
      type: git
      icon: github-circle
      source:
        uri: git@github.com:rseroter/boot-kpack-demo.git
        branch: stable
        private_key: ((github-private-key))
    
    jobs:
    - name: run-tests
      plan:
      - get: source-master
        trigger: true
      - task: first-task
        config: 
          platform: linux
          image_resource:
            type: docker-image
            source: {repository: maven, tag: latest}
          inputs:
          - name: source-master
          run:
              path: sh
              args:
              - -exec
              - |
                cd source-master
                mvn package
    - name: promote-to-stable
      plan:
      - get: source-master
        trigger: true
        passed: [run-tests]
      - get: source-stable
      - put: source-stable
        params:
          repository: source-master
    

    Deploying this pipeline is easy. From the fly CLI tool, it’s one command. Note that my GitHub creds are stored in another file, which is the one I reference in the command.

    fly -t vmworld set-pipeline --pipeline vmworld-pipeline --config vmworld-pipeline.yaml --load-vars-from params.yaml
    

    After unpausing the pipeline, it ran. Once it executed the unit tests, and promoted the master code to the stable branch, the pipeline was green.

    Step #3 – Set up kpack for container builds

    Now to take that tested, high-quality code and containerize it. Cloud Native Buildpacks turn code into Docker images. Buildpacks are something initially created by Heroku, and then used by Cloud Foundry to algorithmically determine how to build a container image based on the language/framework of the code. Instead of developers figuring out how to layer up an image, buildpacks can compile and package up code in a repeatable way by bringing in all the necessary language runtimes and servers. What’s cool is that operators can also extend buildpacks to add org-specific certs, monitoring agents, or whatever else should be standard in your builds.

    kpack is an open-source project from Pivotal that uses Cloud Native Buildpacks, also adds the ability to watch for changes to anything impacting the image, and initiating an update. kpack, which is commercialized as the Pivotal Build Service, watches for changes in source code, buildpacks, or base image and then puts the new or patched image into the registry. Thanks to some smarts, it only updates the impacted layers, thus saving you on data transfer costs and build times.

    The installation instructions are fairly straightforward. You can put this into your Kubernetes cluster in a couple minutes. Once installed, I saw the single kpack controller pod running.

    The only thing left to do was define an image configuration. This declarative config tells kpack where to find the code, and what to do with it. I had already set up a secret to hold my Docker Hub creds, and that corresponding Kubernetes service account is referenced in the image configuration.

    apiVersion: build.pivotal.io/v1alpha1
    kind: Image
    metadata:
      name: vmworld-image
    spec:
      tag: rseroter/vmworld-demo
      serviceAccount: vmworld-service-account
      builder:
        name: default-builder
        kind: ClusterBuilder
      source:
        git:
          url: https://github.com/rseroter/boot-kpack-demo.git
          revision: stable
    

    That’s it. Within moments, kpack detected my code repo, compiled my app, built a container image, cached some layers for later, and updated the Docker Hub image.

    I made a bunch of code changes to generate lots of builds, and all the builds showed up my Kubernetes cluster as well.

    Now when I updated my code, my pipeline automatically kicks off and updates the stable branch. Thus, whenever my tested code changes, or the buildpack gets updated (every week or so) with framework updates and patches, my container automatically gets rebuilt. That’s crazy powerful stuff, especially as we create more and more containers, that deploy to more and more places.

    Step #4 – Deploy the container image

    And that’s the final step. I had to deploy this sucker and see it run.

    First, I pushed it to Pivotal Application Service (PAS) because I make good choices. I can push code or containers here. This single command takes that Docker image, deploys it, and gives me a routable endpoint in 20 seconds.

    cf push vmworld-demo --docker-image rseroter/vmworld-demo -i 2
    

    That worked great, and my endpoint returned the expected values after I added an environment variable to the app.

    Can I deploy the same container to Azure Web Apps? Sure. That takes code or containers too. I walked through the wizard experience in the Azure Portal and chose the Docker Hub image created by kpack.

    After a few minutes, the service was up. Then I set the environment variable that the Spring Boot app was looking for (appruntime to “Azure App Service”) and another to expose the right port (WEBSITES_PORT to 8080), and pinged the RESTful endpoint.

    Whatever tech you land on, just promise me that you’ll invest in a container patching strategy. Automation is non-negotiable, and there are good solutions out there that can improve your security posture, while speeding up software delivery.

  • Fronting web sites, a classic .NET app, and a serverless function with Spring Cloud Gateway

    Fronting web sites, a classic .NET app, and a serverless function with Spring Cloud Gateway

    Automating deployment of custom code and infrastructure? Not always easy, but feels like a solved problem. It gets trickier when you want to use automation to instantiate and continuously update databases and middleware. Why? This type of software stores state which makes upgrades more sensitive. You also may be purchasing this type of software from vendors who haven’t provided a full set of automation-friendly APIs. Let’s zero in on one type of middleware: API gateways.

    API gateways do lots of things. They selectively expose private services to wider audiences. With routing rules, they make it possible to move clients between versions of a service without them noticing. They protect downstream services by offering capabilities like rate limiting and caching. And they offer a viable way for those with a microservices architecture to secure services without requiring each service to do their own authentication. Historically, your API gateway was a monolith of its own. But a new crop of automation-friendly OSS (and cloud-hosted) options are available, and this gives you new ways to deploy many API gateway instances that get continuously updated.

    I’ve been playing around with Spring Cloud Gateway, which despite its name, can proxy traffic to a lot more than just Spring Boot applications. In fact, I wanted to try and create a configuration-only-no-code API Gateway that could do three things:

    1. Weighted routing between “regular’ web pages on the internet.
    2. Add headers to a JavaScript function running in Microsoft Azure.
    3. Performing rate-limiting on a classic ASP.NET Web Service running on the Pivotal Platform.

    Before starting, let me back up and briefly explain what Spring Cloud Gateway is. Basically, it’s a project that turns a Spring Boot app into an API gateway that routes requests while applying cross-cutting functionality for things like security. Requests come in, and if the request matches a declared route, the request is passed through a series of filters, sent to the target endpoint, and “post” filters get applied on the way back to the client. Spring Cloud Gateway built on a Reactive base, which means it’s non-blocking and efficiently handles many simultaneous requests.

    The biggest takeaway? This is just an app. You can write tests and do continuous integration. You can put it on a pipeline and continuously deliver your API gateway. That’s awesome.

    Note that you can easily follow along with the steps below without ANY Java knowledge! Everything I’m doing using configuration you can also do with the Java DSL, but I wanted to prove how straightforward the configuration-only option is.

    Creating the Spring Cloud Gateway project

    This is the first, and easiest, part of this demonstration. I went to start.spring.io, and generated a new Spring Boot project. This project has dependencies on Gateway (to turn this into an API gateway), Spring Data Reactive Redis (for storing rate limiting info), and Spring Boot Actuator (so we get “free” metrics and insight into the gateway). Click this link to generate an identical project.

    Doing weighed routing between web pages

    For the first demonstration, I wanted to send traffic to either spring.io or pivotal.io/spring-app-framework. You might use weighted routing to do A/B testing with different versions of your site, or even to send a subset of traffic to a new API.

    I added an application.yml file (to replace the default application.properties file) to hold all my configuration settings. Here’s the configuration, and we’ll go through it bit by bit.

    spring:
      cloud:
        gateway:
          routes:
          # doing weighted routing between two sites
          - id: test1
            uri: https://www.pivotal.io
            predicates:
            - Path=/spring
            - Weight=group1, 3
            filters:
            - SetPath=/spring-app-framework
          - id: test2
            uri: https://www.spring.io
            predicates:
            - Path=/spring
            - Weight=group1, 7
            filters:
            - SetPath=/
    

    Each “route” is represented by a section in the YAML configuration. A route has a URI (which represents the downstream host), and a route predicate that indicates the path on the gateway you’re invoking. For example, in this case, my path is “/spring” which means that sending a request to “localhost:8080/spring” would map to this route configuration.

    Now, you’ll see I have two routes with the same path. These are part of the same weighted routing group, which means that traffic to /spring will go to one of the two downstream endpoints. The second endpoint is heavily weighted (7 vs 3), so most traffic goes there. Also see that I applied one filter to clear out the path. If I didn’t do this, then requests to localhost:8080/spring would result in a call to spring.io/spring, as the path (and querystring) is forwarded. Instead, I stripped that off for requests to spring.io, and added the secondary path into the pivotal.io endpoint.

    I’ve got Java and Maven installed locally, so a simple command (mvn spring-boot:run) starts up my Spring Cloud Gateway. Note that so far, I’ve written exactly zero code. Thanks to Spring Boot autoconfiguration and dependency management, all the right packages exist and runtime objects get inflated. Score!

    Once, the Spring Cloud Gateway was up and running, I pinged the Gateway’s endpoint in the browser. Note that some browser’s try to be helpful by caching things, which screws up a weighted routing demo! I opened the Chrome DevTools and disabled request caching before running a test.

    That worked great. Our gateway serves up a single endpoint, but through basic configuration, I can direct a subset of traffic somewhere else.

    Adding headers to serverless function calls

    Next, I wanted to stick my gateway in front of some serverless functions running in Azure Functions. You could imagine having a legacy system that you were slowly strangling and replacing with managed services, and leveraging Spring Cloud Gateway to intercept calls and redirect to the new destination.

    For this example, I built a dead-simple JavaScript function that’s triggered via HTTP call. I added a line of code that prints out all the request headers before sending a response to the caller.

    The Spring Cloud Gateway configuration is fairly simple. Let’s walk through it.

    spring:
      cloud:
        gateway:
          routes:
          # doing weighted routing between two sites
          - id: test1
            ...
          # adding a header to an Azure Function request
          - id: test3
            uri: https://seroter-function-app.azurewebsites.net
            predicates:
            - Path=/function
            filters:
            - SetPath=/api/HttpTrigger1
            - SetRequestHeader=X-Request-Seroter, Pivotal
    

    Like before, I set the URI to the target host, and set a gateway path. On the pre-filters, I reset the path (removing the /function and replacing with the “real” path to the Azure Function) and added a new request header.

    I started up the Spring Cloud Gateway project and sent in a request via Postman. My function expects a “name” value, which I provided as a query parameter.

    I jumped back to the Azure Portal and checked the logs associated with my Azure Function. Sure enough, I see all the HTTP request headers, including the random one that I added via the gateway. You could imagine this type of functionality helping if you have modern endpoints and legacy clients and need to translate between them!

    Applying rate limiting to an ASP.NET Web Service

    You know what types of apps can benefit from an API Gateway? Legacy apps that weren’t designed for high load or modern clients. One example is rate limiting. Your legacy service may not be able to handle internet-scale requests, or have a dependency on a downstream system that isn’t mean to get pummeled with traffic. You can apply request caching and rate limiting to prevent clients from burying the legacy app.

    First off, I built a classic ASP.NET Web Service. I hoped to never use SOAP again, but I’m dedicated to my craft.

    I did a “cf push” to my Pivotal Application Service environment and deployed two instances of the app to a Windows environment. In a few seconds, I had a publicly-accessible endpoint.

    Then it was back to my Gateway configuration. To do rate limiting, you need a way to identify callers. You know, some way to say that client X has exceeded their limit. Out of the box, there’s a rate limiter that uses Redis to store information about clients. That means I need a Redis instance. The simplest answer is “Docker”, so I ran a simple command to get Redis running locally (docker run --name my-redis -d -p 6379:6379 redis).

    I also needed a way to identify the caller. Here, I finally had to write some code. Specifically, this rate limiter filter expects a “key resolver.” I don’t see a way to declare one via configuration, so I opened the .java file in my project and added a Bean declaration that pulls a query parameter named “user.” That’s not enterprise ready (as you’d probably pull source IP, or something from a header), but this’ll do.

    @SpringBootApplication
    public class CloudGatewayDemo1Application {
    
      public static void main(String[] args) {	 
       SpringApplication.run(CloudGatewayDemo1Application.class, args);
      }
    	
      @Bean
      KeyResolver userKeyResolver() {
        return exchange -> 
       Mono.just(exchange.getRequest().getQueryParams().getFirst("user"));
      }
    }
    

    All that was left was my configuration. Besides adding rate limiting, I also wanted to to shield the caller from setting all those gnarly SOAP-related headings, so I added filters for that too.

    spring:
      cloud:
        gateway:
          routes:
          # doing weighted routing between two sites
          - id: test1
            ...
            
          # adding a header to an Azure Function request
          - id: test3
            ...
            
          # introducing rate limiting for ASP.NET Web Service
          - id: test4
            uri: https://aspnet-web-service.apps.pcfone.io
            predicates:
            - Path=/dotnet
            filters:
            - name: RequestRateLimiter
              args:
                key-resolver: "#{@userKeyResolver}"
                redis-rate-limiter.replenishRate: 1
                redis-rate-limiter.burstCapacity: 1
            - SetPath=/MyService.asmx
            - SetRequestHeader=SOAPAction, http://pivotal.io/SayHi
            - SetRequestHeader=Content-Type, text/xml
            - SetRequestHeader=Accept, text/xml
    

    Here, I set the replenish rate, which is how many request per second per user, and burst capacity, which is the max number of requests in a single second. And I set the key resolver to that custom bean that reads the “user” querystring parameter. Finally, notice the three request headers.

    I once again started up the Spring Cloud Gateway, and send a SOAP payload (no extra headers) to the localhost:8080/dotnet endpoint.

    A single call returned the expected response. If I rapidly submitted requests in, I saw an HTTP 429 response.

    So almost zero code to do some fairly sophisticated things with my gateway. None of those things involved a Java microservice, although obviously, Spring Cloud Gateway does some very nice things for Spring Boot apps.

    I like this trend of microservices-machinery-as-code where I can test and deploy middleware the same way I do custom apps. The more things we can reliably deliver via automation, the more bottlenecks we can remove.

  • My Pluralsight course—Getting Started with Concourse—is now available!

    Design software that solves someone’s “job to be done“, build it, package it, ship it, collect feedback, learn, and repeat. That’s the dream, right? For many, shipping software is not fun. It’s downright awful. Too many tickets, too many handoffs, and too many hours waiting. Continuous integration and delivery offer some relief, as you keep producing tested, production-ready artifacts. Survey data shows that we’re not all adopting this paradigm as fast as we should. I figured I’d do my part by preparing and delivering a new video training course about Concourse.

    I’ve been playing a lot with Concourse recently, and published a 3-part blog series on using it to push .NET Core apps to Kubernetes. It’s an easy-to-use CI system with declarative pipelines and stateless servers. Concourse runs jobs on Windows or Linux, and works with any programming language you use.

    My new hands-on Pluralsight course is ~90 minutes long, and gives you everything you need to get comfortable with the platform. It’s made up of three modules. The first module looks at key concepts, the Concourse architecture, and user roles, and we set up our local environment for development.

    The second module digs deep into the primitives of Concourse: tasks, jobs and resources. I explain how to configure each, and then we go hands on with each. There are aspects that took me a while to understand, so I worked hard to explain these well!

    The third and final module looks at pipeline lifecycle management and building manageable pipelines. We explore troubleshooting and more.

    Believe it or not, this is my 20th course with Pluralsight. Over these past 8 years, I’ve switched job roles many times, but I’ve always enjoyed learning new things and sharing that information with others. Pluralsight makes that possible for me. I hope you enjoy this new course, and most importantly, start doing CI/CD for more of your workloads!

  • Building an Azure-powered Concourse pipeline for Kubernetes  – Part 3: Deploying containers to Kubernetes

    Building an Azure-powered Concourse pipeline for Kubernetes – Part 3: Deploying containers to Kubernetes

    So far in this blog series, we’ve set up our local machine and cloud environment, and built the initial portion of a continuous delivery pipeline. That pipeline, built using the popular OSS tool Concourse, pulls source code from GitHub, generates a Docker image that’s stored in Azure Container Registry, and produces a tarball that’s stashed in Azure Blob Storage. What’s left? Deploying our container image to Azure Kubernetes Service (AKS). Let’s go.

    Generating AKS credentials

    Back in blog post one, we set up a basic AKS cluster. For Concourse to talk to AKS, we need credentials!

    From within the Azure Portal, I started up an instance of the Cloud Shell. This is a hosted Bash environment with lots of pre-loaded tools. From here, I used the AKS CLI to get the administrator credentials for my cluster.

    az aks get-credentials --name seroter-k8s-cluster --resource-group demos --admin

    This command generated a configuration file with URLs, users, certificates, and tokens.

    I copied this file locally for use later in my pipeline.

    Creating a role-binding for permission to deploy

    The administrative user doesn’t automatically have rights to do much in the default cluster namespace. Without explicitly allowing permissions, you’ll get some gnarly “does not have access” errors when doing most anything. Enter role-based access controls. I created a new rolebinding named “admin” with admin rights in the cluster, and mapped to the existing clusterAdmin user.

    kubectl create rolebinding admin --clusterrole=admin --user=clusterAdmin --namespace=default

    Now I knew that Concourse could effectively interact with my Kubernetes cluster.

    Giving AKS access to Azure Container Registry

    Right now, Azure Container Registry (ACR) doesn’t support an anonymous access strategy. Everything happens via authenticated users. The Kubernetes cluster needs access to its container registry, so I followed these instructions to connect ACR to AKS. Pretty easy!

    Creating Kubernetes deployment and service definitions

    Concourse is going to apply a Kubernetes deployment to create pods of containers in the cluster. Then, Concourse will apply a Kubernetes service to expose my pod with a routable endpoint.

    I created a pair of configurations and added them to the ci folder of my source code.

    The deployment looks like:

    apiVersion: extensions/v1beta1
     kind: Deployment
     metadata:
       name: demo-app
       namespace: default
       labels:
         app: demo-app
     spec:
       replicas: 1
       template:
         metadata:
           labels:
             app: demo-app
         spec:
           containers:
           - name: demo-app
             image: myrepository.azurecr.io/seroter-api-k8s:latest
             imagePullPolicy: Always
             ports:
             - containerPort: 8080
           restartPolicy: Always 
    

    This is a pretty basic deployment definition. It points to the latest image in the ACR and deploys a single instance (replicas: 1).

    My service is also fairly simple, and AKS will provision the necessary Azure Load Balancer and public IP addresses.

     apiVersion: v1
     kind: Service
     metadata:
       name: demo-app
       namespace: default
       labels:
         app: demo-app
     spec:
       selector:
         app: demo-app
       type: LoadBalancer
       ports:
         - name: web
           protocol: TCP
           port: 80
           targetPort: 80 
    

    I now had all the artifacts necessary to finish up the Concourse pipeline.

    Adding Kubernetes resource definitions to the Concourse pipeline

    First, I added a new resource type to the Concourse pipeline. Because Kubernetes isn’t a baked-in resource type, we need to pull in a community definition. No problem. This one’s pretty popular. It’s important than the Kubernetes client and server are expecting the same Kubernetes version, so I set the tag to match my AKS version.

    resource_types:
    - name: kubernetes
      type: docker-image
      source:
        repository: zlabjp/kubernetes-resource
        tag: "1.13"
    

    Next, I had to declare my resource itself. It has references to the credentials we generated earlier.

    resources:
    - name: azure-kubernetes-service
      type: kubernetes
      icon: azure
      source:
        server: ((k8s-server))
        namespace: default
        token: ((k8s-token))
        certificate_authority: |
          -----BEGIN CERTIFICATE-----
          [...]
          -----END CERTIFICATE-----
    

    There are a few key things to note here. First, the “server” refers to the cluster DNS server name in the credentials file. The “token” refers to the token associated with the clusterAdmin user. For me, it’s the last “user” called out in the credentials file. Finally, let’s talk about the certificate authority. This value comes from the “certificate-authority-data” entry associated with the cluster DNS server. HOWEVER, this value is base64 encoded, and I needed a decoded value. So, I decoded it, and embedded it as you see above.

    The last part of the pipeline? The job!

    jobs:
    - name: run-unit-tests
      [...]
    - name: containerize-app
      [...]
    - name: package-app
      [...]
    - name: deploy-app
      plan:
      - get: azure-container-registry
        trigger: true
        passed:
        - containerize-app
      - get: source-code
      - get: version
      - put: azure-kubernetes-service
        params:
          kubectl: apply -f ./source-code/seroter-api-k8s/ci/deployment.yaml -f ./source-code/seroter-api-k8s/ci/service.yaml
      - put: azure-kubernetes-service
        params:
          kubectl: |
            patch deployment demo-app -p '{"spec":{"template":{"spec":{"containers":[{"name":"demo-app","image":"myrepository.azurecr.io/seroter-api-k8s:'$(cat version/version)'"}]}}}}' 
    

    Let’s unpack this. First, I “get” the Azure Container Registry resource. When it changes (because it gets a new version of the container), it triggers this job. It only fires if the “containerize app” job passes first. Then I get the source code (so that I can grab the deployment.yaml and service.yaml files I put in the ci folder), and I get the semantic version.

    Next I “put” to the AKS resource, twice. In essence, this resource executes kubectl commands. The first command does a kubectl apply for both the deployment and service. On the first run, it provisions the pod and exposes it via a service. However, because the container image tag in the deployment file is to “latest”, Kubernetes actually won’t retrieve new images with that tag after I apply a deployment. So, I “patched” the deployment in a second “put” step and set the deployment’s image tag to the semantic version. This triggers a pod refresh!

    Deploy and run the Concourse pipeline

    I deployed the pipeline as a new revision with this command:

    fly -t rs set-pipeline -c azure-k8s-final.yml -p azure-k8s-final

    I unpaused the pipeline and watched it start up. It quickly reached and completed the “deploy to AKS” stage.

    But did it actually work? I jumped back into the Azure Cloud Shell to check it out. First, I ran a kubectl get pods command. Then, a kubectl get services command. The first showed our running pod, and the second showed the external IP assigned to my pod.

    I also issued a request to that URL in the browser, and got back my ASP.NET Core API results.

    Also to prove that my “patch” command worked, I ran the kubectl get deployment demo-app –output=yaml command to see which container image my deployment referenced. As you can see below, it no longer references “latest” but rather, a semantic version number.

    With all of these settings, I now have a pipeline that “just works” whenever I updated my ASP.NET Core source code. It tests the code, packages it up, and deploys it to AKS in seconds. I’ve added all the pipelines we created here to GitHub so that you can easily try this all out.

    Whatever CI/CD tool you use, invest in automating your path to production.